
Biology (MindTap Course List)
11th Edition
ISBN:9781337392938
Author:Eldra Solomon, Charles Martin, Diana W. Martin, Linda R. Berg
Publisher:Eldra Solomon, Charles Martin, Diana W. Martin, Linda R. Berg
Chapter53: Introduction To Ecology: Population Ecology
Section: Chapter Questions
Problem 6TYU: The largest population that can be maintained by a particular environment for an indefinite period...

Related questions
Question
give the correct answer
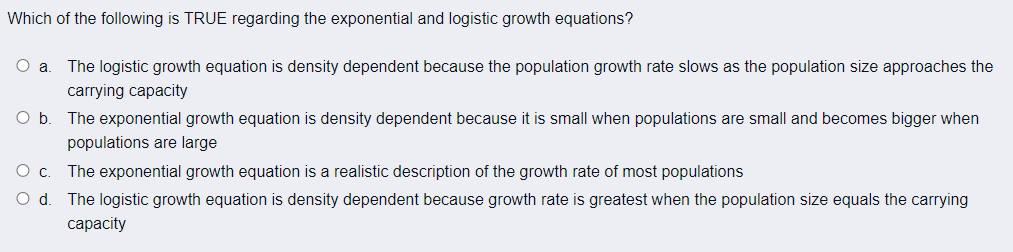
Transcribed Image Text:Which of the following is TRUE regarding the exponential and logistic growth equations?
The logistic growth equation is density dependent because the population growth rate slows as the population size approaches the
carrying capacity
The exponential growth equation is density dependent because it is small when populations are small and becomes bigger when
populations are large
Oc.
The exponential growth equation is a realistic description of the growth rate of most populations
O d
The logistic growth equation is density dependent because growth rate is greatest when the population size equals the carrying
сарacty
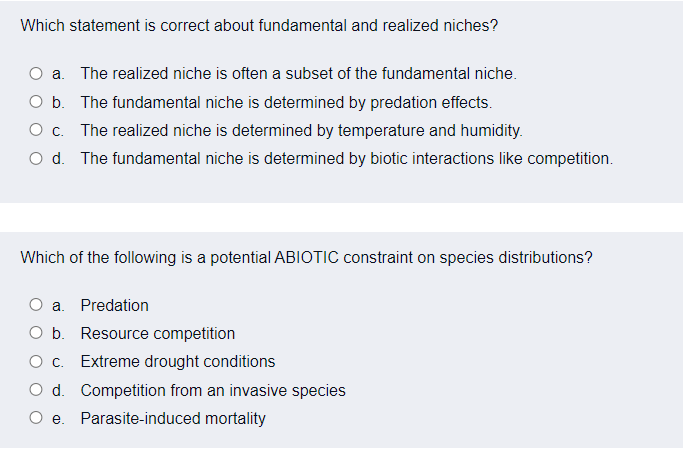
Transcribed Image Text:Which statement is correct about fundamental and realized niches?
a. The realized niche is often a subset of the fundamental niche.
O b. The fundamental niche is determined by predation effects.
O c. The realized niche is determined by temperature and humidity.
O d. The fundamental niche is determined by biotic interactions like competition.
Which of the following is a potential ABIOTIC constraint on species distributions?
O a. Predation
O b. Resource competition
Oc. Extreme drought conditions
O d. Competition from an invasive species
O e. Parasite-induced mortality
Expert Solution
This question has been solved!
Explore an expertly crafted, step-by-step solution for a thorough understanding of key concepts.

This is a popular solution!

Trending now
This is a popular solution!

Step by step
Solved in 3 steps

Knowledge Booster


Learn more about
Need a deep-dive on the concept behind this application? Look no further. Learn more about this topic, biology and related others by exploring similar questions and additional content below.Recommended textbooks for you
Biology (MindTap Course List)
Biology
ISBN:
9781337392938
Author:
Eldra Solomon, Charles Martin, Diana W. Martin, Linda R. Berg
Publisher:
Cengage Learning

Biology Today and Tomorrow without Physiology (Mi…
Biology
ISBN:
9781305117396
Author:
Cecie Starr, Christine Evers, Lisa Starr
Publisher:
Cengage Learning
Biology (MindTap Course List)
Biology
ISBN:
9781337392938
Author:
Eldra Solomon, Charles Martin, Diana W. Martin, Linda R. Berg
Publisher:
Cengage Learning
Biology Today and Tomorrow without Physiology (Mi…
Biology
ISBN:
9781305117396
Author:
Cecie Starr, Christine Evers, Lisa Starr
Publisher:
Cengage Learning