

Q: Question 2: Calculate the mean, median, mode, and variance for the following dataset which…
A: Given: n = 20 Formula Used: Mean = ∑F·X∑F Median = l + n2-CFF×h Median class = n2 l = lower class of…
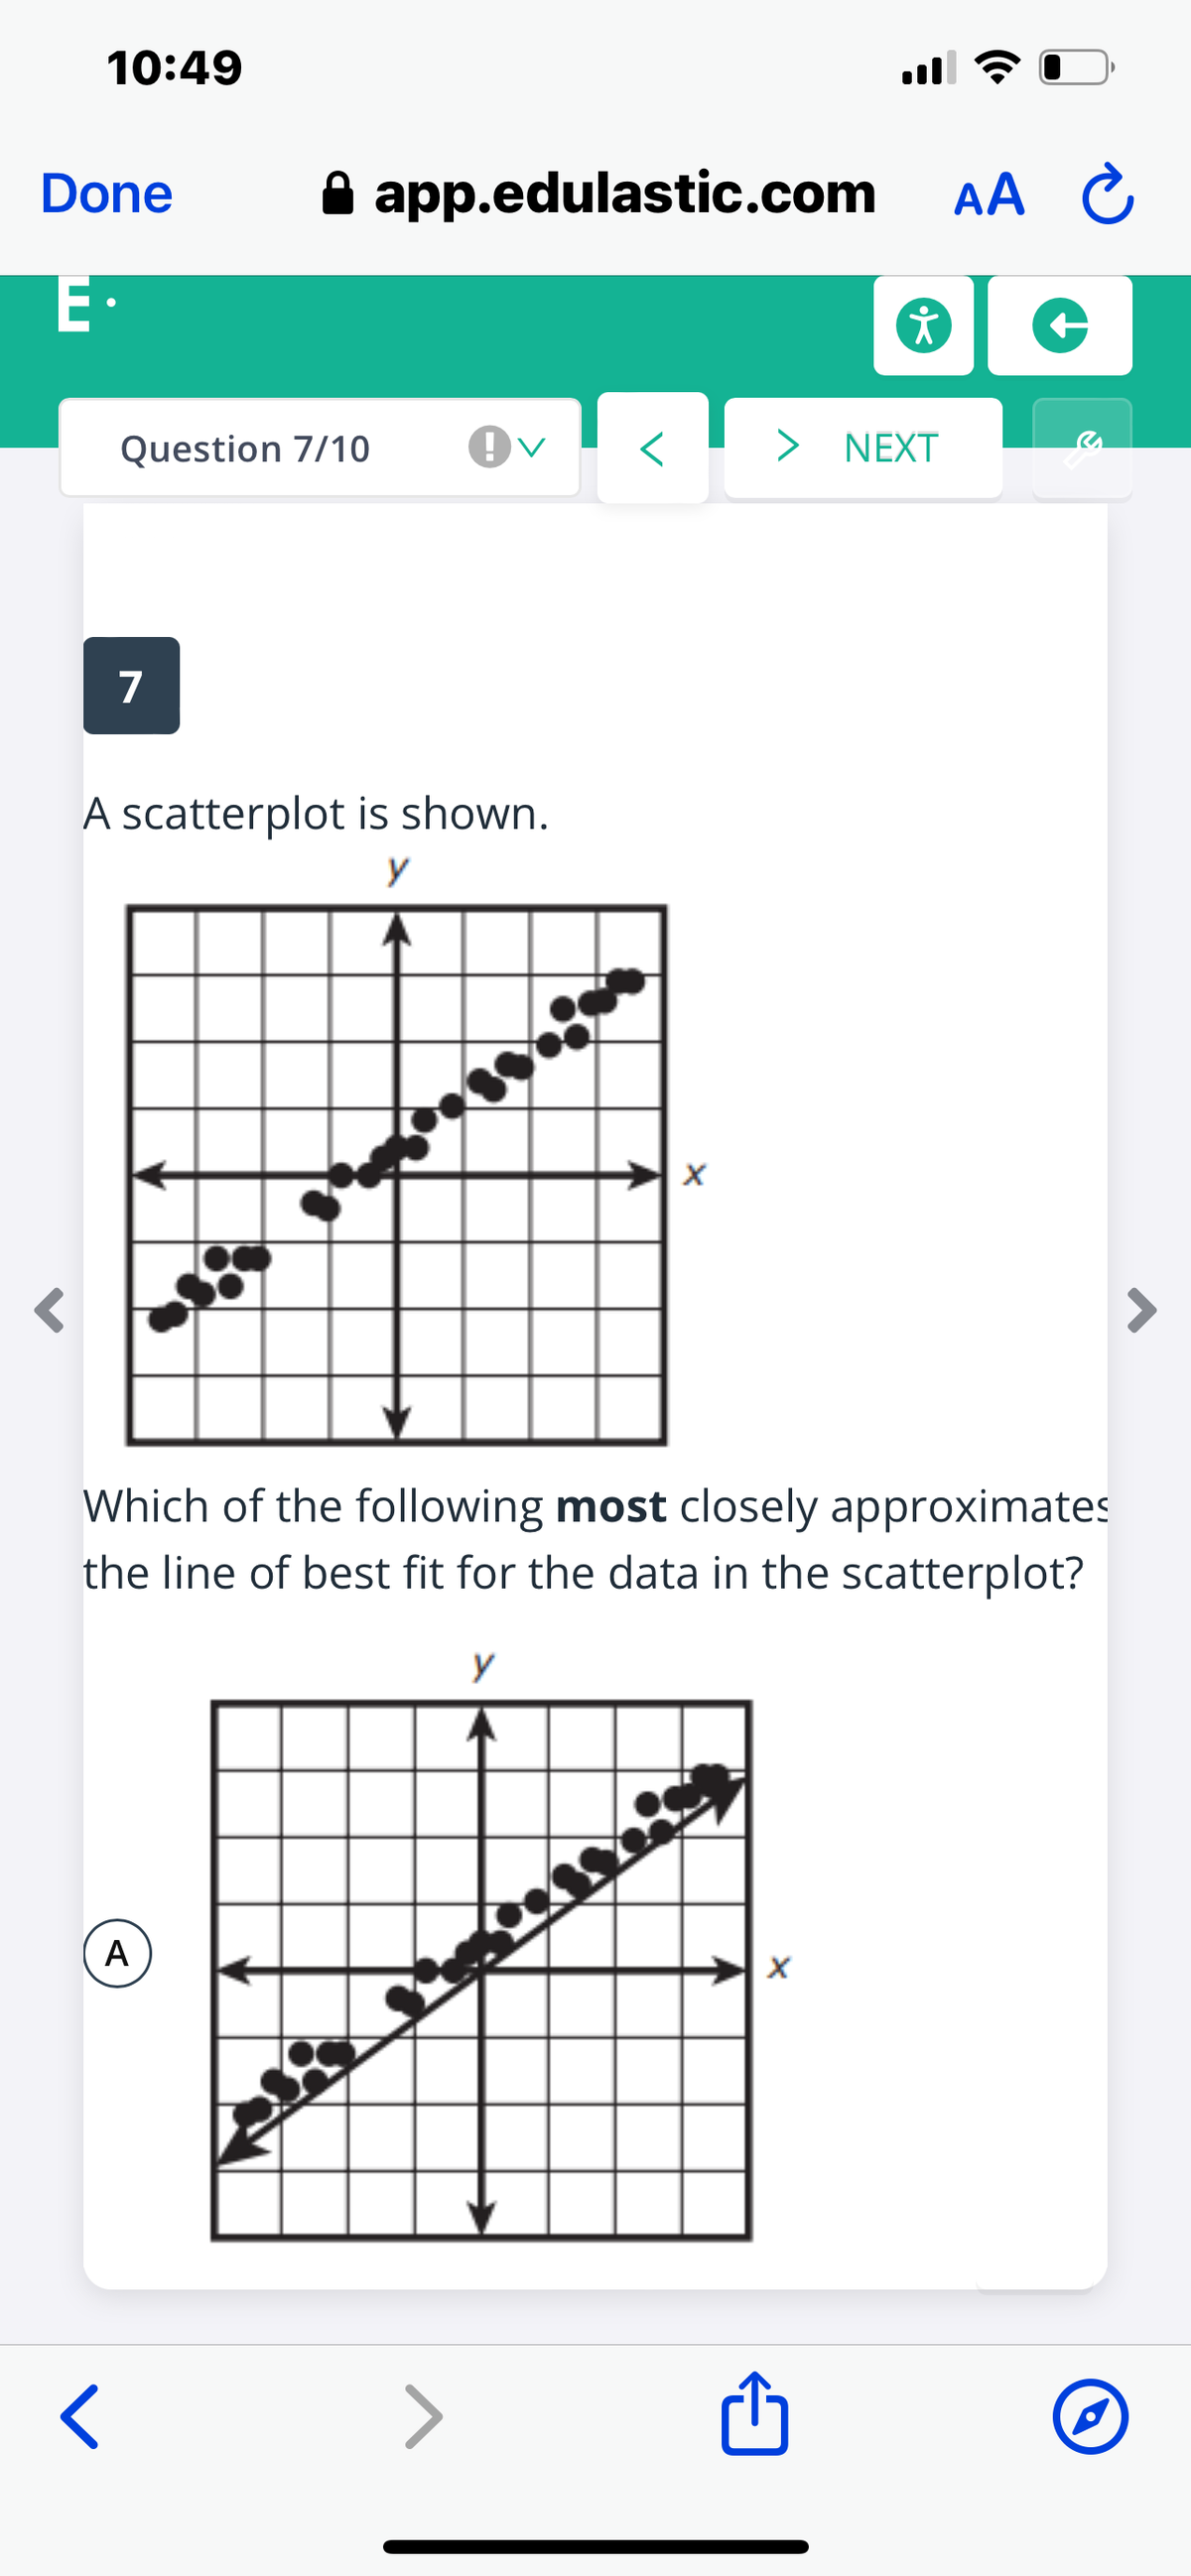
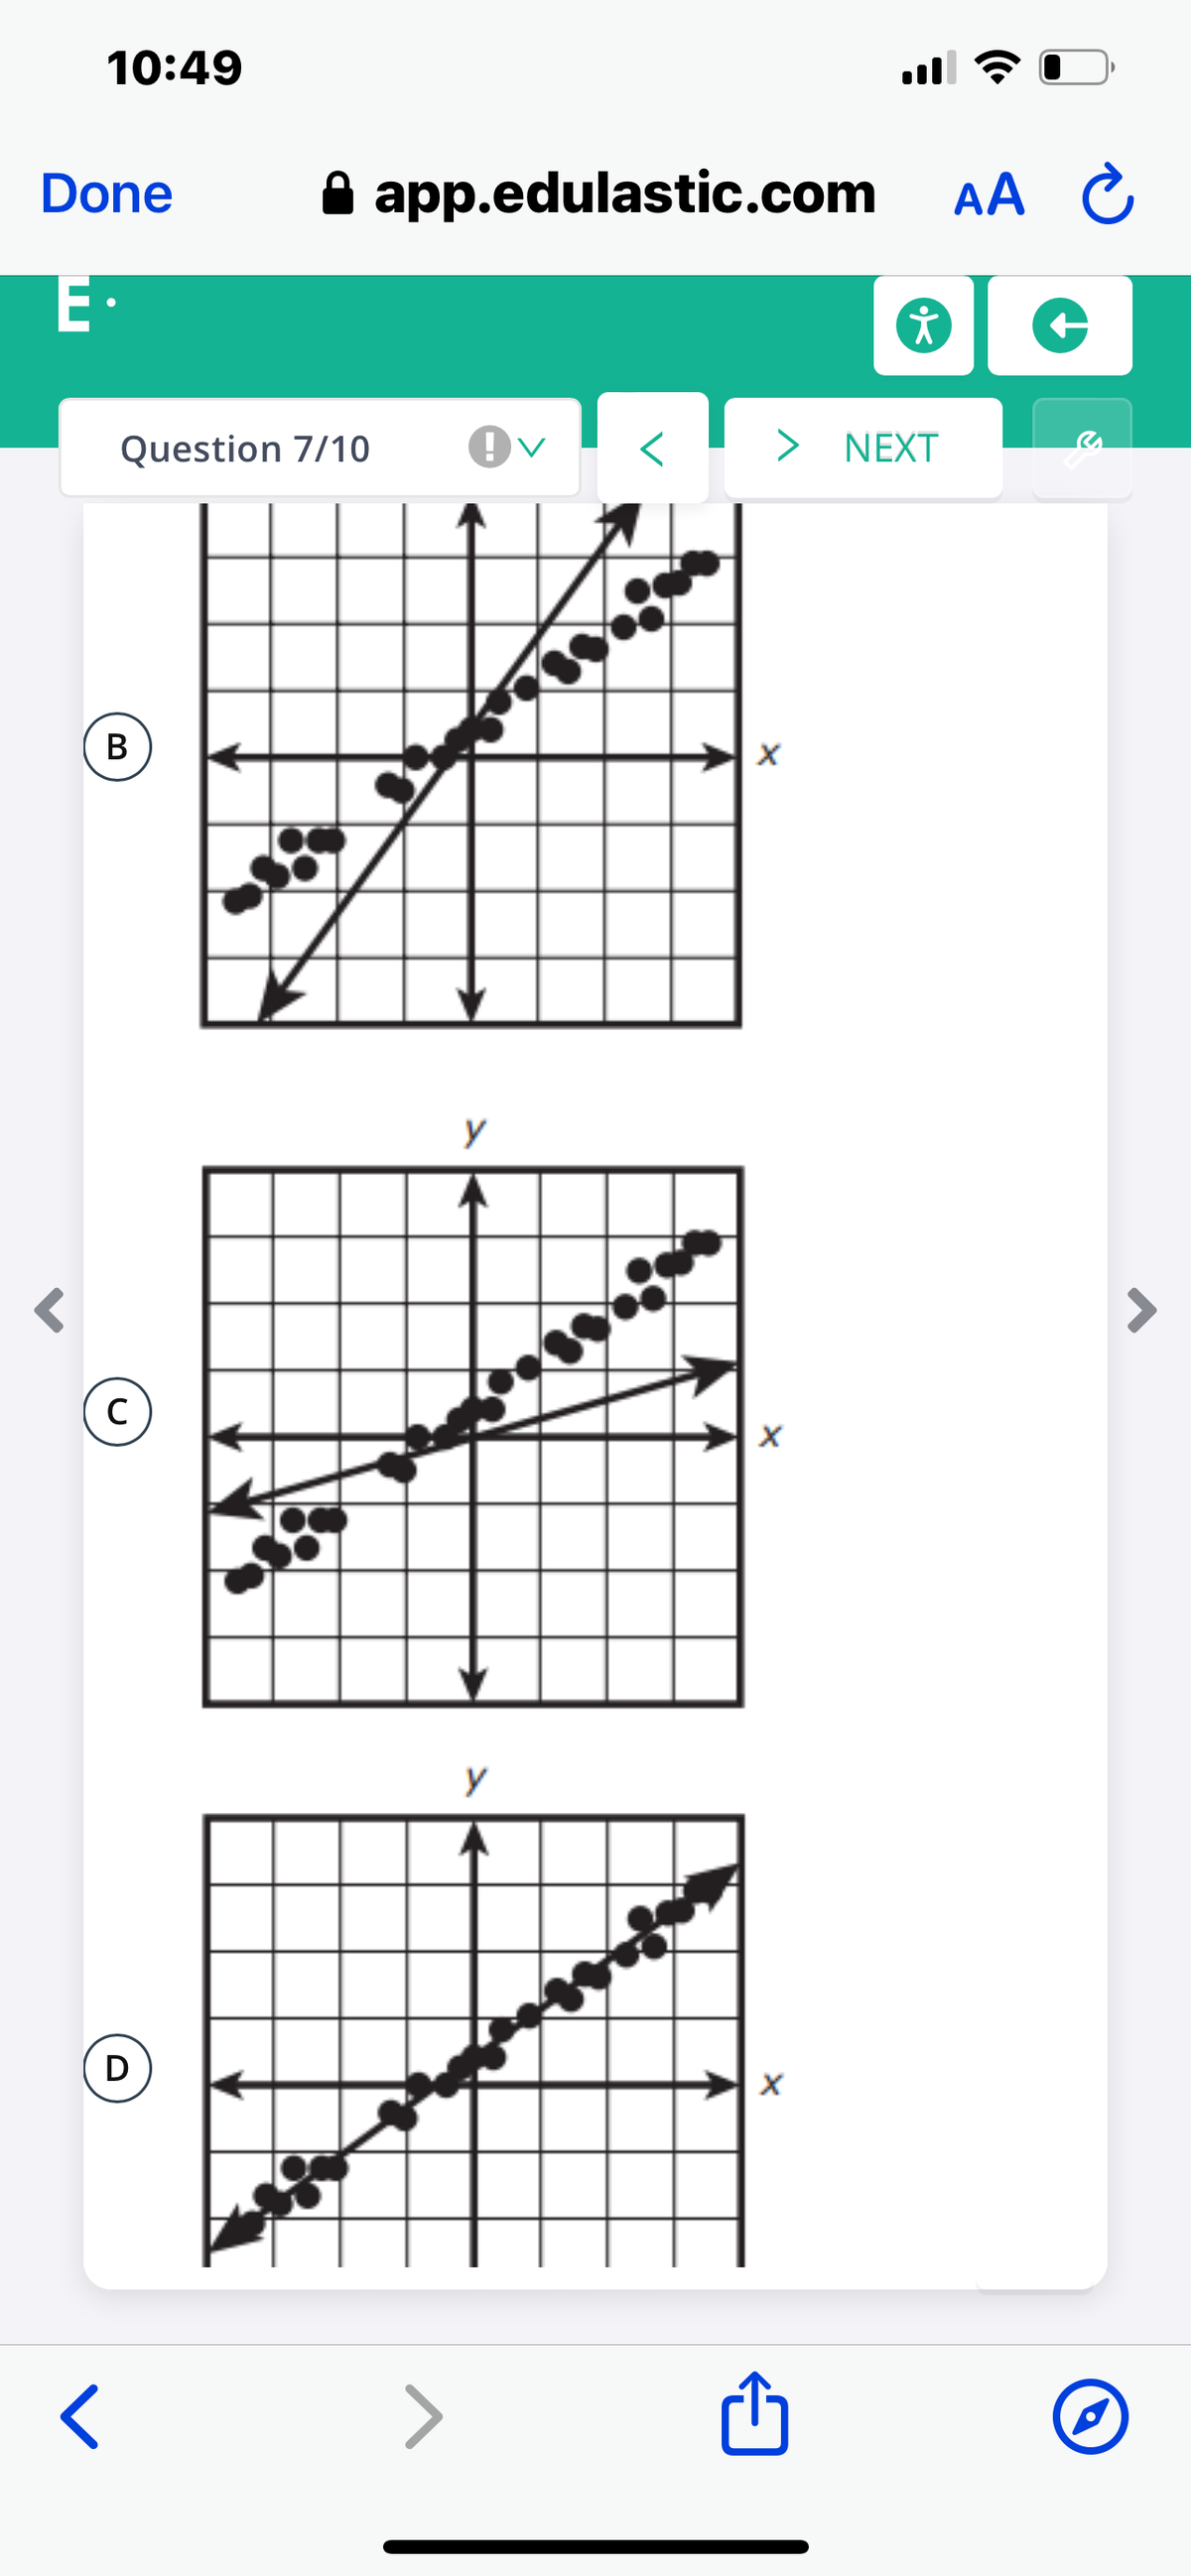
Q: For each of the scatter plots below, determine whether there is a perfect positive linear…
A:
Q: If a set of data has a very weak negative correlation, the residual values will be a) Very large с.…
A: answer is D very small residual = obeserved - predicted value so for negative weak correlation it…
Q: 1. Consider the following data:
A: Given, x -0.5 -0.2 0.2 0.7 f(x) 1.2840 1.1052 0.9048 0.7047
Q: hich of these shows the strongest correla
A: A scatterplot is a graphic plot in which two sets of data are plotted against each other, along two…
Q: Which two of the four scatter plots have most positive correlation and closer to zero correlation
A: The most positive correlation is showing in plot B because there is an increasing trend present.…
Q: Estimate the correlation coefficient that would best describe the data below. O -0.4 0.4 0.9 -0.9
A: The correct option is (- 0.9) The detailed solution is as follows below:
Q: please highlight the correct answer
A:
Q: 9. Which of the following plots indicate a sample correlation coefficient close to 0? A. First plot…
A: If there is no correlation then the value of the correlation coefficient is 0.
Q: Which of the following is the value of the correlation between time and the amount of data…
A: Let X denote the time And Y denote amount of data transferred.
Q: Which of the following values of the correlation r indicates the strongest correlation between the…
A: The correlation coefficient r measures the direction and strength of the linear relationship between…
Q: The Cabo Fiesta Mexican Restaurant is trying to determine whether sales of its popular Pan Con Mucho…
A: Given that, The Cabo Fiesta Mexican Restaurant is trying to determine whether sales of its popular…
Q: Determine whether each statement is true or false, and explain why A correlation coefficient of zero…
A: Correlation coefficients are indicators of the strength of the linear relationship between two…
Q: Enter the mode of the following dataset: 14, 14, 14, 22, 22, 4, 18, 16, 10 Ex: 1
A: Given data is: 14, 14, 14, 22, 22, 4, 18, 16, 10
Q: Do all the predictors help to explain Y , or is only a subsetof the predictors useful?
A: Coefficient of determination state how much variability of the dependent variable is explained by…
Q: Which of the following is the best Interpretation of the correlation coefficient?
A: Correlation is measure that used to determine the relationship exist between two numerical variable.…
Q: A researcher records the age and price for a group of used cars. What kind of correlation, in terms…
A: A researcher records the age and price for a group of used cars. Since we know that the price of a…
Q: Here is a scatter plot for two variables from a set of data. 8. 8,9 What would you estimate the…
A: Hi! Thank you for the question As per the honor code, We’ll answer the first question since the…
Q: Suppose that for a set of (x,y) data, r = 0.36. Find the linear correlation coefficient. Do not…
A: Here the coefficient of determination is given as 0.36, from this value we need to compute the value…
Q: what is indicated by a positive value for a correlation
A: Positive value for a correlation indicates that increase in X tend to be accompanied by increase in…
Q: Below is the Minitab display of the scatterplot and regression line for a sample of 10 pharmacies.…
A: Since you have asked multiple questions, we will solve first three sub-parts for you. To get…
Q: What is the correlation coefficient for this data set? r=
A: here given , the regression line equation y = -74.19x + 47.89 so slope = -74.19 y- intercept =…
Q: Estimate the correlation depicted by the following scatterplot:
A: Here given the Scatter plot
Q: The initial salaries of 20 students who take the FSH course are 4000 5000 6000 4750 4000 5000 6750…
A: If, there are n data points, the data value corresponding to the 75% value of this data will be the…
Q: Based on the given data, is the purchase of hot dogs independent of the purchase of hamburgers? If…
A: Given data: Hot Dogs Hot Dogs¯ Sum Hamburger 2000 500 2500 Hamburger¯ 1000 1500 2500…
Q: Find the value of the correlation coefficient for the data shown in the table. Round to the nearest…
A: Find the correlation formula for the given function:
Q: The number of hours 10 students spent studying for a test and their scores on that test are shown in…
A: To determine the t test statistic, first we have to calculate the linear correlation coefficient…
Q: State whether the data described below are discrete or continuous, and explain why. The weights of…
A: To state whether the data described below are discrete or continuous. The weights of acorns that…
Q: Which of the following Pearson correlations indicates that the data points would be clustered most…
A: Pearson correlations are given.
Q: Which of the following is the dependent variable in an experiment studying the effect of rainfall on…
A: Dependent variable: The variable changes or affected by other variables is known as dependent…
Q: coefficients
A: X y 58.5 -100.8 59.9 771.6 75 -1365.4 60.6 -660.3 66.8 1306.9 63.5 1061.3 57.8 -645.3…
Q: If the value of the Pearson correlation is r=+1.00 or -1.00, then all data points in a scatter plot…
A: Correlation: Correlation a measure which indicates the “go-togetherness” of two data sets. It can be…
Q: What type of correlation is exhibited by the following graph?
A: Consider the given graph. The given graph is a scatterplot. A scatterplot is a plot in which two…
Q: Match the calculated correlations to the corresponding scatterplot. (1) (2) (3) (4) DI
A: Solution
Q: Which of the following Pearson correlations indicates that the data point would be clustered most…
A: Postive correlation When the value of one variable increase with increase in another variable then…
Q: Find the linear correlation coefficient for the data
A: Let X denotes the placement exam rating And Y denote the GWA of students.
Q: A zero correlation bewteen X and Y is least likely to occur if?
A: The strength and direction of linear relationship between two variables is measured by correlation,…
Q: interpret this results by testing each correlation hypothesis.
A: Given: Correlation coefficient r=0.005 Hypothesis: Null hypothesis: H0: ρ=0 Alternative hypothesis:…
Q: Construct a scatter plot for the given data. Determine whether there is a positive correlation,…
A:
Q: What type of relationship or correlation would exist between the following two variables: Size of a…
A:
Q: Consider the following data: 2, 9, 5, 11, 7, 3. a. Calculate its mean and variance. b. If…
A:
Q: An aerobic exercise instructor remembers the data given in the following table, which shows the…
A: Let us determine the linear correlation coefficient for the given data in the next steps.
Q: Which of the following best describes the Pearson correlation for these data?
A: The required values can be calculated as:
Q: Choose the most likely correlation value for this scatterplot: r = 0.436 Ir = 0.100 r= -0.897 r =…
A: Correlation between two variables measure the strength and direction between two variables. It…
Q: Which of the following scatter plots shows a weak, positive linear association between variables? A…
A: A scatter plot helps in representing the relationship or an association between two defined…
Q: Consider the following table of data. 2 3 4 y 1 1 1 1.1 (a) Calculate the correlation coefficient.…
A:
Q: Which of these gives the best measure of central tendency for the given data
A: We know that, there are following measures of Central tendency are: Mean or Arithmetic Mean…
Q: Which scatter plot shown has a correlation coefficient, r, closest to -0.5?
A:
Q: Which of the following pairs of variables is likely to have a positive correlation? Check all that…
A: We know that the Correlation measure the linear association between two variable i.e. whether two…


Trending now
This is a popular solution!

Step by step
Solved in 2 steps with 2 images

- The attached data contains Part Quality data of three suppliers. At = 0.05, does Part Quality depend on Supplier, or should the cheapest Supplier be chosen?A glass manufacturing company wanted to investigate the effect of breakoff pressure and stopper height on the percentage of breaking off chips. The results are in the accompanying table. Complete parts (a) through (e). a. At the 0.01 level of significance is there an interaction between the breakoff pressure and the stopper height? b. is there an effect due to the breakoff pressure? c. is there an effect due to the stopper height? d. Plot the percentage breakoff for each breakoff pressure for each stopper height. e. Discuss the results of (a) through (d).Q1 A) List down the measures of central tendency and measures of dispersion 2) The operations manager of a plant that manufactures tires wants to compare the actual inner diameters of two grades of tires, each of B) which is expected to be 575 millimeters. A sample of five tires of each grade was selected, and the results representing the inner diameters of the tires, ranked from smallest to largest, are as follows. Grade X grade Y 568 570 575 578 584 573 574 575 577 578 requirement. a) for each of the tow grades of tries, compute the mwan, median, and standred deviation. b) which grade of tire providing better quality? explain. c) what would be the effect on your answer in (a) and (b) if the last value for grade Y were 588 insert 578 explain. C) The file contins the overall miles per gallon (MPG) OF 2010 family sedan: 24 21 22 23 24 34 34 34 20 20 22 22 44 32 20 20 22 20 39 20 Source:…
- You obtained the following raw data when setting up a Biuret standard curve: BSA (mg/ml) Absorbancy 540nm 0 0.158 1 0.210 2 0.260 3 0.305 4 0.360 5 0.410 6 0.455 7 0.510 8 0.530 9 0.550 10 0.554 What would the quality of the line-fit (R2 value) be if you do not exclude experimental outliers? (Give you answer to 4 decimal places)Refer to Exercise 7. Assume that p = 4.3 ± 0.1 cm and q = 2.1 ± 0.2 cm. Estimate f, and find the relative uncertainty in the estimate.A simple random sample of heights of 6400Englishmen has a mean of 67.85 inches and SD 2.56 inches, while a simple random sample of heights of 1600 Australians has a mean of 68.55 inches and SD of 2.52 inches. D the data indicate that Australians are, on the average, taller than Englishmen?
- In forestry, the diameter of a tree at breast height is used to model the height of the tree. Silviculturists working in British Columbia’s boreal forest conducted a series of spacing trials to predict the heights of several species of trees. The data are the breast height diameters (in centimeters) and heights (in meters) for a sample of 18 white spruce trees. B1 B2 18.9 20.0 15.5 16.8 19.4 20.2 20.0 20.0 29.8 20.2 19.8 18.0 20.3 17.8 20.0 19.2 22.0 22.3 16.6 18.8 15.5 16.9 13.7 16.3 27.5 21.4 20.3 19.2 22.9 19.8 14.1 18.5 10.1 12.1 5.8 8.0 B1: Breast Height Diameter of White spruce (cm) B2: Height (m) a) Plot the relationship using scatter diagram between the breast height diameters and the trees’ height. Are the breast height diameters and the trees’ height linearly related? What can you infer about the relationship between the two variables? Is a linear model appropriate? b) Compare the scatter plot in (a) with the correlation coefficient…In a summary report given by Ing. Pobbi on the lengths of ironrods produced by two machines, he stated that the variability ofmachine A was higher compared to that of machine B. Critiquethe report of the Engineer given data on the length of rodsproduced given as; MachineA(cm): 380 410 280 310 305 360 270 355 400 Machine B(m): 1.1 1.3 1.2 2.0 1.5 1.6 1.4 1.6 1.7The article “Effect of Varying Solids Concentration and Organic Loading on the Performance of Temperature Phased Anaerobic Digestion Process” (S. Vandenburgh and T. Ellis, Water Environment Research, 2002:142–148) discusses experiments to determine the effect of the solids concentration on the performance of treatment methods for wastewater sludge. In the first experiment, the concentration of solids (in g/L) was 43.94 ± 1.18. In the second experiment, which was independent of the first, the concentration was 48.66 ± 1.76. Estimate the difference in the concentration between the two experiments, and find the uncertainty in the estimate.
- Based on teh attached data, does it appear that magnets reduce backpain?You also conducted a review of the research literature and found that similar studies examining the relationship between alcohol consumption and liver cancer found the following: Smithson et al. RR 3.3 (95% CI:1.95-5.20) Ribera et al. RR 2.1 (95% CI:1.17-3.33) Gonzalez et al. RR 2.75 (95% CI 2.26-3.45) Which one of Hill’s criteria does this illustrate? Explain.After doing AVONA on the SPSS I got result of sig. 0.165. What does that say about my data and hypothesis? How should I comment on it?