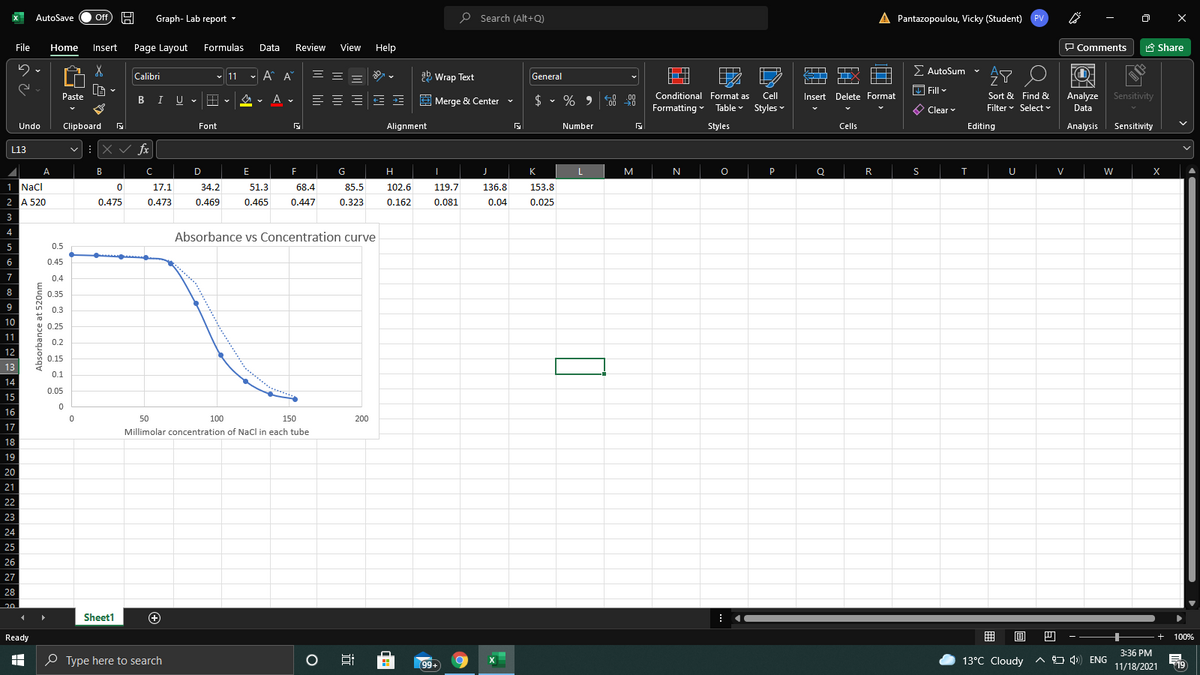
Which of the following types of data produce curves similar in shape to the graph? Select all that apply 1.Bacterial growth in a culture 2.A normal distribution of height in a population of students 3.Exponential population growth 4.Haemoglobin binding of oxygen 5.Log transformations of drug dose curves 6.Osmotic fragility of red blood cells 7.A standard curve for an enyme assay
Which of the following types of data produce curves similar in shape to the graph? Select all that apply 1.Bacterial growth in a culture 2.A normal distribution of height in a population of students 3.Exponential population growth 4.Haemoglobin binding of oxygen 5.Log transformations of drug dose curves 6.Osmotic fragility of red blood cells 7.A standard curve for an enyme assay

Essentials Health Info Management Principles/Practices
4th Edition
ISBN:9780357191651
Author:Bowie
Publisher:Bowie
Chapter4: Introduction To The Patient Record
Section4.2: Provider Responsibilities
Problem 1E

Related questions
Question
Which of the following types of data produce curves similar in shape to the graph? Select all that apply
1.Bacterial growth in a culture
2.A normal distribution of height in a population of students
3.Exponential population growth
4.Haemoglobin binding of oxygen
5.Log transformations of drug dose curves
6.Osmotic fragility of red blood cells
7.A standard curve for an enyme assay
Transcribed Image Text:P Search (Alt+Q)
A Pantazopoulou, Vicky (Student)
AutoSave
ff
Graph- Lab report -
PV
File
Home
Insert
Page Layout
Formulas
Data
Review
View
Help
P Comments
A Share
- A A
== =
ab Wrap Text
2 AutoSum v
Calibri
v 11
General
TTT
Fill -
Paste
B IU v
A
= ==
$
Conditional Format as
Cell
Insert Delete Format
Sort & Find &
Analyze
Sensitivity
E Merge & Center v
.00
.00
Formatting - Table v Styles v
O Clear v
Filter v Select ♥
Data
Undo
Clipboard
Font
Alignment
Number
Styles
Cells
Editing
Analysis
Sensitivity
:X v fx
L13
A
B
D
G
H
K
N
P
R
S
U
V
X
1 Nacl
17.1
34.2
51.3
68.4
85.5
102.6
119.7
136.8
153.8
2 A 520
0.475
0.473
0.469
0.465
0.447
0.323
0.162
0.081
0.04
0.025
3
4
Absorbance vs Concentration curve
5
0.5
6
0.45
7
0.4
8
0.35
9
0.3
10
Y 0.25
11
0.2
12
0.15
13
0.1
********
14
0.05
15
16
50
100
150
200
17
Millimolar concentration of Nacl in each tube
18
19
20
21
22
23
24
25
26
27
28
20.
Sheet1
+
Ready
100%
3:36 PM
O Type here to search
99+
13°C Cloudy a O 4)) ENG
19
11/18/2021
Absorbance at 520nm
Expert Solution
This question has been solved!
Explore an expertly crafted, step-by-step solution for a thorough understanding of key concepts.

Step by step
Solved in 2 steps

Knowledge Booster


Learn more about
Need a deep-dive on the concept behind this application? Look no further. Learn more about this topic, biology and related others by exploring similar questions and additional content below.Recommended textbooks for you
Essentials Health Info Management Principles/Prac…
Health & Nutrition
ISBN:
9780357191651
Author:
Bowie
Publisher:
Cengage
Essentials Health Info Management Principles/Prac…
Health & Nutrition
ISBN:
9780357191651
Author:
Bowie
Publisher:
Cengage