

Q: The midpoint of ABAB is at (−4,3)(-4,3). If A=(1,−2)A=(1,-2), find BB.
A:
Q: Find the coordinates of the point that is equidistant from ( — 2, 5), (8, 5),and (6, 7).
A: Given: The points A=(x1, y1)=(-2,5), B=(x2, y2)=(8,5), C=(x3, y3)=(6,7) To find: The point P=(x,y)…
Q: Find the midpoint of PQ. P( -6, 7) and Q( 3, 1)
A:
Q: What is the length of the line segment? A(-3,4) -5 4 -3 -2 -1 2 3 4 5 -2 -3 B(2,-3) O 5 O V74 O 7 O…
A:
Q: Determine whether the points are collinear.(−1, −3), (−4, 7), (2, −13)
A:
Q: What is the distance of these two points -2,6 5,9
A: Given the co-ordinates (−2,6) and (5,9)
Q: Plot the given points in a coordinate plane.
A: We have to plot the points in the coordinate plane, the points are of the form x1,y1=0,5 ,…
Q: Plot the points (0, 5), ( – 3, 0), (5, – 1), ( – 5, 2).
A: Given points 0,5,-3,0,5,-1,-5,2 Our aim is to plot the points in x and y coordinates (x,y) axes
Q: A(2 2,4), B(3/2/4,4),(2it12)
A: A=12,2,4B=32,1,4C=12,1,2
Q: find the midpoint and distance for  A (0, 5), B (12, 3) and A (-3, -4), B (5, 5)
A:
Q: Find the coordinates of the midpoint of the segment with endpoints: F(-8, -6) and E(-10, 2).
A: We have to find the coordinates of the mid-point of the segment with endpoints: F-8, -6 and E-10, 2.…
Q: Is there a straight line that passes through the points? P, (2,0,1), P2(3, –2,0), P3(1,2,2)
A: If a line is passing through three points, then the points are said to be collinear. The vector that…
Q: Find the distance between P2(4, 6, 8) and P1(3, 4, 6)
A: This question can be solved by applying distance formula.
Q: Is there a straight line that passes through the points? P; (2,0,1), P2(3,–2,0), P3(1,2,2)
A:
Q: What are the coordinates of point P, the image of point (3, –4) after Rywx? А. (3.4) B. (-3,4) С.…
A: The point given is (3, -4)
Q: Find the area of the triangle determined by the points P(-3, 6, -4), Q(8, 8, -5), and R(-1, -1, -7).
A:
Q: Find area of the triangle with edges (-1,2,4),(1,-2,3),(-2,3,-1)
A:
Q: Given (-8, 5) and (-1, 5), what is the distance between the two points The distance is
A: Given points x1,y1=(-8,5)x2,y2=(-3,5) Our aim is to find distance between this two points
Q: Find the midpoint of the segment PQ. (а) Р(3, 7), Q(5, 13) (b) Р(-2, 3), Q(8, —7)
A:
Q: What is 8,9 reflected over y-axis
A: The point (8,9) is shown in the graph,
Q: Find all points that simultaneously lie 3 units from each of the points (2, 0, 0), (0, 2, 0), and…
A: Let such a point is (x,y,z)
Q: Find the area of the triangle determined by the points A(-1,4, 7), B(3, –1,2) and С(4,4, 4).
A: It is given that, A(-1,4,7) , B(3,-1,2) , C(4,4,4) We have to find the area of triangle determined…
Q: 9. P(-4, 7), Q(1,-5)
A: Given:P-4,7 and Q1,-5Midpoint:M=x1+x22 , y1+y22
Q: Calculate the length of PQ where P = (-2,1,6) and Q = (-3,4, –1).
A: We will find the length of PQ→ in the following step
Q: How would i determine whether the three points are collinear? (0,-7), (-3,-21), (2,3)
A:
Q: Find the perimeter of the triangle whose vertices are the following specified points in the plane.…
A:
Q: The point (3, 7) is a
A: Follow the procedure given below.
Q: What is the midpoint between the points A: (-3, -4) and B: (6, 1)? 77, 22 3 3, 2 2
A:
Q: Determine whether the points are collinear.(−1, 0), (1, 1), (3, 3)
A: Now slope of the line joining the points A and B is, Now slope of the line joining the points B and…
Q: Plot the points (3, –1), (3, 2), and (3, 4)
A:
Q: Find the midpoint of the segment with endpoints: (-3,4) and (0,8). O (-1.5, 12) O (-1.5 , 6) O…
A: Formula to Find the Midpoint To find the midpoint of the straight line in a graph, we use this…
Q: Find the point on the xx-axis that is equidistant from the points (6,1)(6,1) and (3,7)
A: Let the given points be A(6,1) and B(3,7). Let P(x, 0) be the point on the x-axis which is…
Q: What are the points of intersection of y = 10x? – 10 and y = 5x (-0.78, -3.9) and (6.4, 1.3)…
A:
Q: What Is the area of the parallelogram? |(3, 8), (6, 5) (3. - 3)* (6, - 6)
A:
Q: Find the midpoint of the line segment whose end points are given. (8, 8) and (5, -4) .2) O (13, 4) O…
A:
Q: Mark all points that are on the line y = 4x – 7. O (3, 5) (– 2, – 15) O (4, – 7) O(- 3, – 20)
A: Given : y = 4x - 7
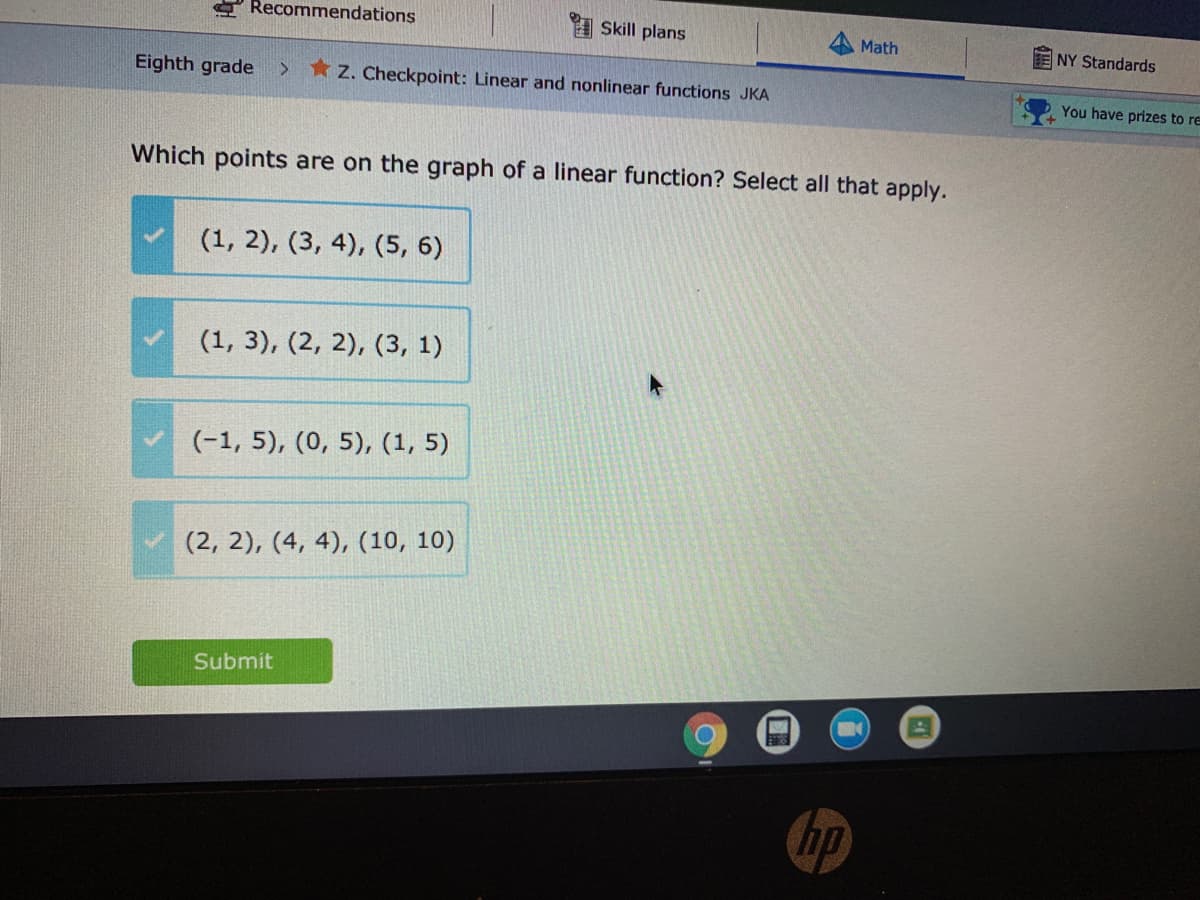
Q: Determine whether the points are collinear.(1, 2), (3, 4), (5, 6)
A: Given the points ( 1, 2 ), ( 3, 4 ), ( 5, 6 ). For the points to be collinear, area of the triangle…
Q: Determine whether the points (-6, 5), (1, 7), and (16, 10) are collinear.
A: Given: -6,5, 1,7 and 16,10 Concept Used: Three points are collinear if area of triangle is zero.…
Q: determine the distance between the points A(2,3) & B(-4,6)
A:
Q: Find the area of a square who’s vertices have the coordinates (3,6),(3,1),(-2,1),(-2,6 
A:
Q: 6. The midpoint between the points A(-2,-3,1) and B(6,9, –3) is (b) (2,3, –1). (c) (-4, –6,2). (a)…
A: Midpoint of line joining (x1,y1,z1) and (x2,y2,z2) is (x1+x22,y1+y22,z1+z22)
Q: What is the midpoint if L(-6,5) and R(5,7)?
A:
Q: The straight line L1 that passes through the points P1 (2, 8) and P2 (7, 5), and the straight line…
A:
Q: related
A:
Q: Determine whether the points are collinear.(−2, 5), (0, −1), (3, −9)
A: We have to determine the given points are collinear or not: -2,5, 0,-1, 3,-9 We know that three…
Q: Find the midpoint between the two points. 17. (1,1), (5,5) 19. (3,0), (5,-4) 21. (0,-5), (3,-2
A:
Q: find the midpoint for A( -4 , 3 ) B( -1 , 5 )
A: Use the mid point formula when two points are given.
Q: Which point is further from point P( 4, 5): K( -3, 1) or N( 8, 7) ?
A: Given pointsP(4,5)K(-3,1)N(8,7)
Q: Determine whether the points lie on a straight line: A(2,4,2), B(3,7,-2), C(1,3,3)
A: Given, The points A(2,4,2), B(3,7,-2) and C(1,3,3) We have to find whether the points lie on a…
Q: Plot the given points in a coordinate plane.
A: Point A - (-5, 0) Point B - (2, 0) Point C - (2.6, -1.3) Point D - (-2.5, 3.5)

Step by step
Solved in 2 steps with 1 images


- Dropping Rocks on Mars The behavior of objects falling near Earths surface depends on the mass of Earth. On Mars, a much smaller planet than Earth, things are different. If Galileo had performed his experiment on Mars, he would have obtained the following table of data. t = seconds V = feet per second 0 0 1 12.16 2 24.32 3 36.48 4 48.64 5 60.8 a. Show that these data can be modeled by a linear function, and find a formula for the function. b. Calculate V10 and explain in practical terms what your answer means. c. Galileo found that the acceleration due to gravity of an object falling near Earths surface was 32 feet per second per second. Physicists normally denote this number by the letter g. If Galileo had lived on Mars, what value would he have found for g?Later High School Graduates This is a continuation of Exercise 16. The following table shows the number, in millions, graduating from high school in the United States in the given year. Year Number graduating in millions 2001 2.85 2003 2.98 2005 3.11 2007 3.24 a. Find the slope of the linear function modeling high school graduations, and explain in practical terms the meaning of the slope. b. Find a formula for a linear function that models these data. c. Express, using functional notation, the number graduating from high school in 2008, and then calculate the value. d. The actual number graduating from high school in 1994 was about 2.52 million. Compare this with the value given by the formula in part b and with your answer to part of Exercise 16. Which is closer to the actual value? In general terms, what was the trend in high school graduations from 1985 to 2007? 16. High School Graduates The following table shows the number, in millions, graduating from high school in the United States in the given year.16 Year Number graduating in millions 1985 2.83 1987 2.65 1989 2.47 1991 2.29 a. By calculating difference, show that these data can be modeled using a linear function. b. What is the slope for the linear function modeling high school graduations? Explain in practical terms the meaning of the slope. c. Find a formula for a linear function that models these data. d. Express, using functional notation, the number graduating from high school in 1994, and then use your formula from part c to calculate that value.TEST YOUR UNDERSTADING FOR EXAMPLE 3.3 The State of New York also has an income tax. The tax table for New York shows that a single New York resident with a taxable income of 15,000 owes 671 in New York income tax. If the taxable income is 15,500, then the table shows a tax liability of 701. Assume that the state tax is a linear function of taxable income, and find the tax owed if the taxable income is 15,350. EXAMPLE 3.3 OKLAHOMA INCOME TAX The amount of income tax T=T(l), in dollars, owed to the state of Oklahoma is a linear function of the taxable income l, in dollars, at least over a suitably restricted range of incomes. According to the Oklahoma Income Tax table for the year 2015, a single Oklahoma resident taxpayer with a taxable income of 15,000 owes 579 in Oklahoma income tax. In functional notation, this is T(15,000)=579. If the taxable income is 15,500, then the table shows a tax liability of 605. Part 1 Calculate the rate of change in T with respect to I, and explain in practical terms what it means. Part 2 How much does the taxpayer owe if the taxable income is 15,350?
- Does the following table represent a linear function ? If so, find the linear equation that models the data.When Date Are Unevenly speed. If data are evenly spaced, we need only calculate differences to see whether the data are linear. But if data are not evenly spaced, then we must calculate the average rate of change over each interval to see whether the data are linear. If the average rate of change is constant, it is the slope of the linear function. This fact is used in Exercises 23 and 24. In the following table, show that the average rate of change from 2 to 5 is not the same as the average rate of change from 5 to 6. This shows that the data are not linear, even though the differences in y are constant. x 1 2 5 6 y 3 6 9 12When Date Are Unevenly speed. If data are evenly spaced, we need only calculate differences to see whether the data are linear. But if data not evenly spaced, then we must calculate the average rate of change over each interval to see whether the data are linear. If the average rate of changes is constant, it is the slope of the linear function. This fact is used in Exercises 23 and 24. In the following table, show that the average rate of change is the same over each interval. This shows the data are linear, even though the differences in y are not constant. Then find a linear model for the data. x 1 2 5 6 y 7 10 19 22
- Employee Turnover The percentage of employees who cease their employment during a year is referred to as employee turnover, and it is a serious issue for businesses. The following table shows the cost, in millions of dollars, to Walmart for a given employee turnover percentage in a year.13 E = employee turnover 10 20 30 40 C = cost 250 400 550 700 a. Show that the data can be modeled by a linear function. b. Find the slope of the linear function. c. Find a linear model for the data. d. Use the result from part c to find the cost to Walmart if employee turnover is 33 in a year.Price of Amazons Kindle The following table shows the price of Amazons Kindle 2 e-book reader. It is adapted from data available on the web. Here time is measured in months since February 2009, when the Kindle was launched. Time Price 0 349 5 299 10 249 15 199 a. By calculating differences, show that these data can be modeled using a linear function. b. Find a linear formula that models these data. Be careful about the sign of the slope. c. What price does your formula from part b project for January 2012 35 months after the Kindle was launched? Note: The web data were the basis for speculation that some day the Kindle would be free.High School Graduates The following table shows the number, in millions, graduating from high school in the United States in the given year. Year Number graduating in millions 1985 2.83 1987 2.65 1989 2.47 1991 2.29 a. By calculating difference, show that these data can be modeled using a linear function. b. What is the slope for the linear function modeling high school graduations? Explain in practical terms the meaning of the slope. c. Find a formula for a linear function that models these data. d. Express, using functional notation, the number graduating from high school in 1994, and then use your formula from part c to calculate that value.
- 6. Tuition at American Private Universities The following table shows the average yearly tuition and required fees, in dollars, charged by four-year American private nonprofit universities in the school year ending in the given year. Date Average tuition 2012 27,870 2013 29,004 2014 30,138 2015 31,272 2016 32,406 a. Show that these data can be modeled by a linear function, and find its formula. b. Plot the data points and add the graph of the linear formula you found in part a. c. What prediction does this formula give for average tuition and fees at four-year American private nonprofit universities for the academic year ending in 2021?Tuition at American Public Universities This is a continuation of Exercise 6. The following table shows the average yearly in-state tuition and required fees, in dollars, charged by four-year American public universities in the school year ending in the given year. Date Average tuition 2012 8318 2013 8595 2014 8872 2015 9149 2016 9426 a. Show that these data can be modeled by a linear function, and find its formula. b. What is the slope for the linear function modeling tuition and required fees for public universities? c. What is the slope of the linear function modeling tuition and required fees for private universities? Note: See Exercise 6. d. Explain what the information in parts b and c tells you about the rate of increase in tuition in public versus private institutions. e. Which type of institution shows the larger percentage increase from 2015 to 2016? 6. Tuition at American Private Universities The following table shows the average yearly tuition and required fees, in dollars, charged by four-year American private nonprofit universities in the school year ending in the given year. Date Average tuition 2012 27, 870 2013 29, 004 2014 30, 138 2015 31, 272 2016 32, 406 a. Show that these data can be modeled by a linear function, and find its formula. b. Plot the data points and add the graph of the linear formula you found in part a. c. What prediction does this formula give for average tuition and fees at four-year American private nonprofit universities for the academic year ending in 2021?


