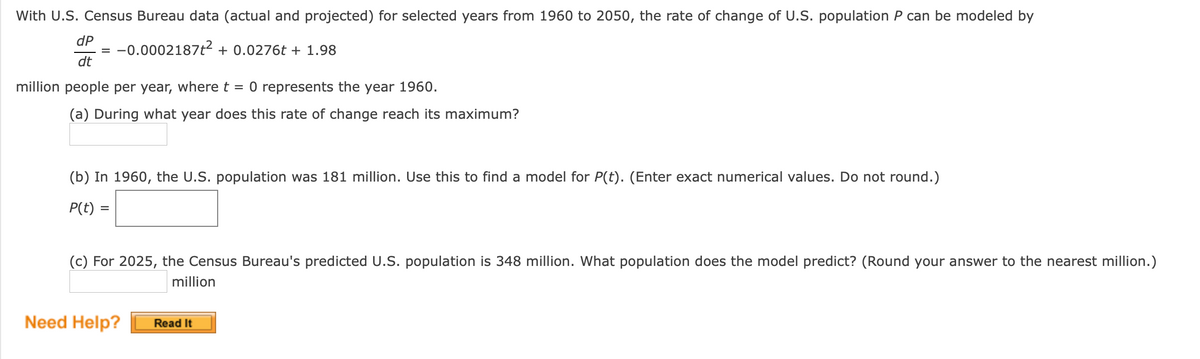
With U.S. Census Bureau data (actual and projected) for selected years from 1960 to 2050, the rate of change of U.S. population P can be modeled by dP = -0.0002187t² + 0.0276t + 1.98 dt million people per year, wheret = 0 represents the year 1960. (a) During what year does this rate of change reach its maximum? (b) In 1960, the U.S. population was 181 million. Use this to find a model for P(t). (Enter exact numerical values. Do not round.) P(t) = (c) For 2025, the Census Bureau's predicted U.S. population is 348 million. What population does the model predict? (Round your answer to the nearest million.) million Need Help? Read It


Continuous Probability Distributions
Probability distributions are of two types, which are continuous probability distributions and discrete probability distributions. A continuous probability distribution contains an infinite number of values. For example, if time is infinite: you could count from 0 to a trillion seconds, billion seconds, so on indefinitely. A discrete probability distribution consists of only a countable set of possible values.
Normal Distribution
Suppose we had to design a bathroom weighing scale, how would we decide what should be the range of the weighing machine? Would we take the highest recorded human weight in history and use that as the upper limit for our weighing scale? This may not be a great idea as the sensitivity of the scale would get reduced if the range is too large. At the same time, if we keep the upper limit too low, it may not be usable for a large percentage of the population!


Trending now
This is a popular solution!

Step by step
Solved in 3 steps with 3 images


