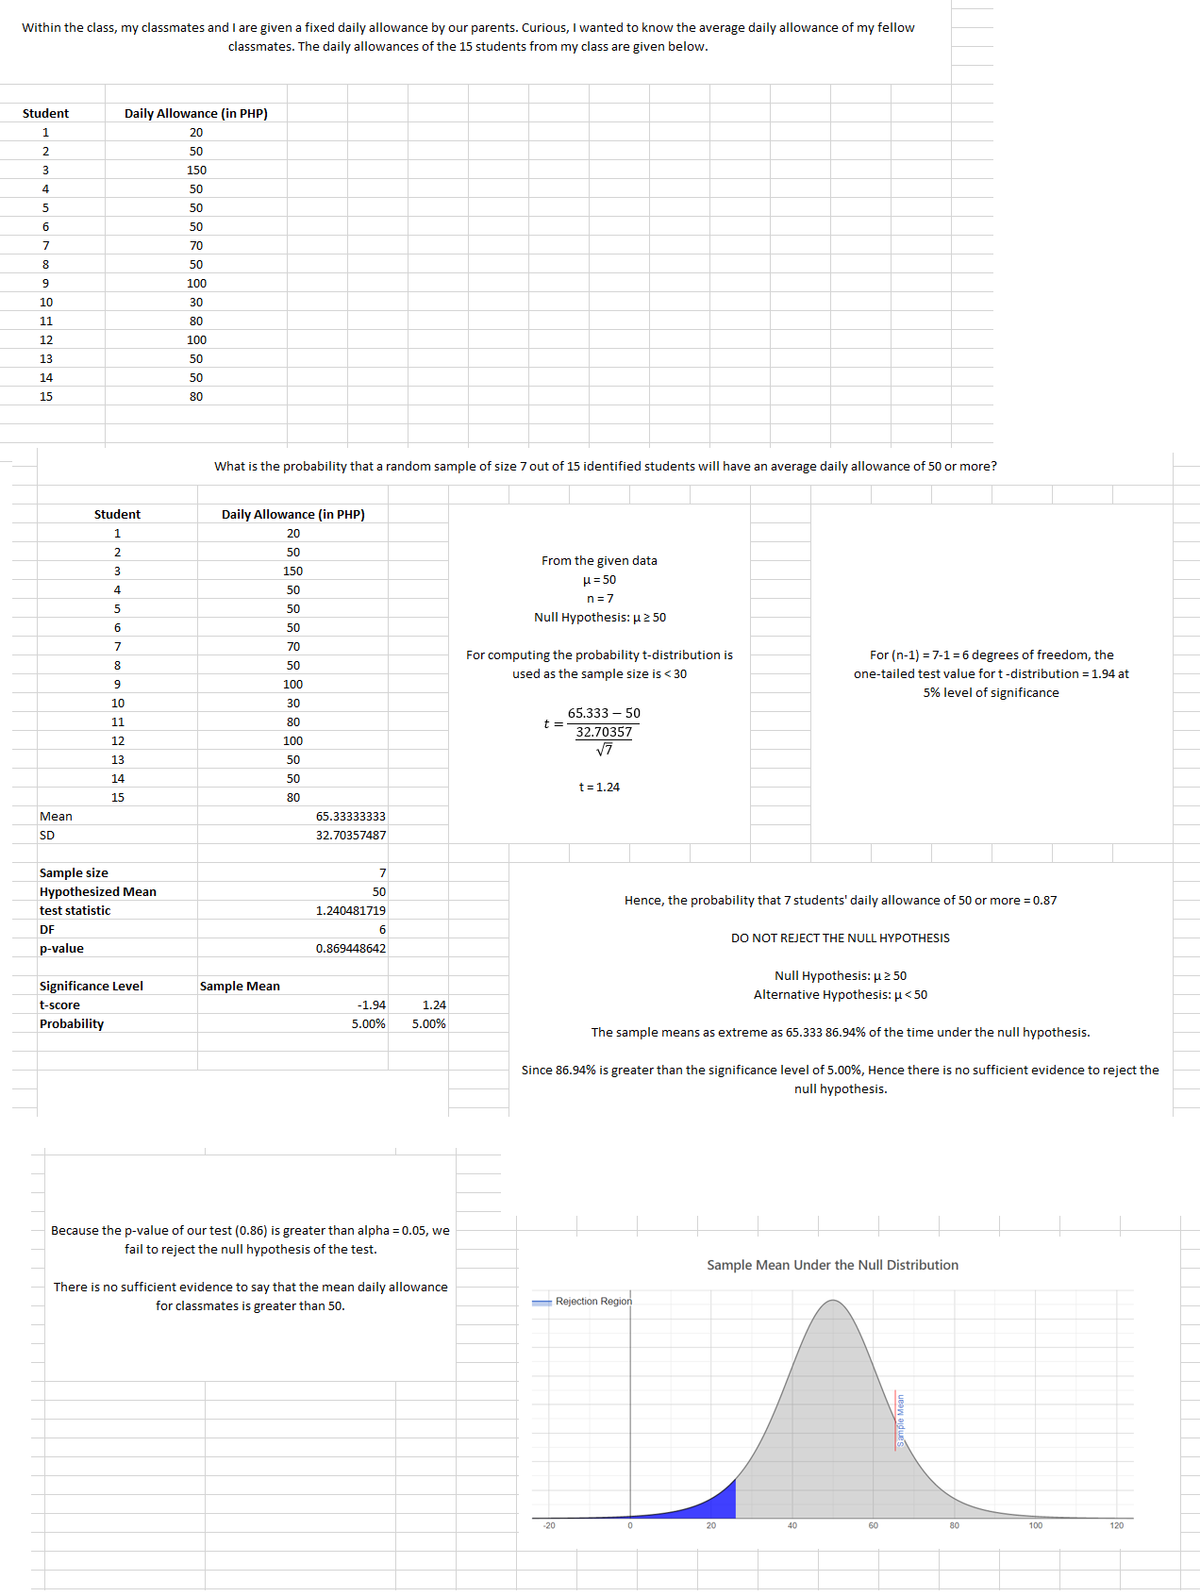
Within the class, my classmates and I are given a fixed daily allowance by our parents. Curious, I wanted to know the average daily allowance of my fellow classmates. The daily allowances of the 15 students from my class are given below. Daily Allowance (in PHP) 1 20 2 50 3 150 4 50 5 50 6 50 IT 7 70 8 50 9 100 10 30 11 80 12 100 13 50 50 80 Student 14 15 What is the probability that a random sample of size 7 out of 15 identified students will have an average daily allowance of 50 or more?
Within the class, my classmates and I are given a fixed daily allowance by our parents. Curious, I wanted to know the average daily allowance of my fellow classmates. The daily allowances of the 15 students from my class are given below. Daily Allowance (in PHP) 1 20 2 50 3 150 4 50 5 50 6 50 IT 7 70 8 50 9 100 10 30 11 80 12 100 13 50 50 80 Student 14 15 What is the probability that a random sample of size 7 out of 15 identified students will have an average daily allowance of 50 or more?

Algebra: Structure And Method, Book 1
(REV)00th Edition
ISBN:9780395977224
Author:Richard G. Brown, Mary P. Dolciani, Robert H. Sorgenfrey, William L. Cole
Publisher:Richard G. Brown, Mary P. Dolciani, Robert H. Sorgenfrey, William L. Cole
Chapter2: Working With Real Numbers
Section2.3: Rules For Addition
Problem 8P

Related questions
Question
PLEASE MAKE A REFLECTION OR INTERPRETATION FOR THIS ONE AND RELATE IT TO REAL LIFE.
Transcribed Image Text:Within the class, my classmates and I are given a fixed daily allowance by our parents. Curious, I wanted to know the average daily allowance of my fellow
classmates. The daily allowances of the 15 students from my class are given below.
Student
1
2
3
4
5
6
7
8
9
10
11
12
13
14
15
Mean
SD
Daily Allowance (in PHP)
20
50
150
50
50
50
70
50
100
30
80
100
50
50
80
Student
1
2
3
4
5
6
7
8
9
10
11
12
13
14
15
Sample size
Hypothesized Mean
test statistic
DF
p-value
Significance Level
t-score
Probability
What is the probability that a random sample of size 7 out of 15 identified students will have an average daily allowance of 50 or more?
Daily Allowance (in PHP)
20
50
150
50
50
50
70
50
100
30
80
100
50
50
80
Sample Mean
65.33333333
32.70357487
7
50
1.240481719
6
0.869448642
-1.94 1.24
5.00% 5.00%
Because the p-value of our test (0.86) is greater than alpha = 0.05, we
fail to reject the null hypothesis of the test.
There is no sufficient evidence to say that the mean daily allowance
for classmates is greater than 50.
From the given data
μ = 50
n=7
Null Hypothesis: μ ≥ 50
For computing the probability t-distribution is
used as the sample size is < 30
t =
65.333-50
32.70357
√7
t = 1.24
Hence, the probability that 7 students' daily allowance of 50 or more = 0.87
For (n-1)=7-1= 6 degrees of freedom, the
one-tailed test value for t -distribution = 1.94 at
5% level of significance
Rejection Region
DO NOT REJECT THE NULL HYPOTHESIS
The sample means as extreme as 65.333 86.94% of the time under the null hypothesis.
Null Hypothesis: μ ≥ 50
Alternative Hypothesis: μ<50
Since 86.94% is greater than the significance level of 5.00%, Hence there is no sufficient evidence to reject the
null hypothesis.
20
Sample Mean Under the Null Distribution
40
60
80
100
Expert Solution
This question has been solved!
Explore an expertly crafted, step-by-step solution for a thorough understanding of key concepts.

Step by step
Solved in 3 steps with 3 images

Recommended textbooks for you
Algebra: Structure And Method, Book 1
Algebra
ISBN:
9780395977224
Author:
Richard G. Brown, Mary P. Dolciani, Robert H. Sorgenfrey, William L. Cole
Publisher:
McDougal Littell

Holt Mcdougal Larson Pre-algebra: Student Edition…
Algebra
ISBN:
9780547587776
Author:
HOLT MCDOUGAL
Publisher:
HOLT MCDOUGAL

Algebra: Structure And Method, Book 1
Algebra
ISBN:
9780395977224
Author:
Richard G. Brown, Mary P. Dolciani, Robert H. Sorgenfrey, William L. Cole
Publisher:
McDougal Littell
Holt Mcdougal Larson Pre-algebra: Student Edition…
Algebra
ISBN:
9780547587776
Author:
HOLT MCDOUGAL
Publisher:
HOLT MCDOUGAL

Algebra & Trigonometry with Analytic Geometry
Algebra
ISBN:
9781133382119
Author:
Swokowski
Publisher:
Cengage