

Q: What does the term “attainable set” mean?
A: The art of deciding the investment mix and policy, making the investments equivalent to its…
Q: What does vertical analysis try to reveal
A: The comparative study of financial line items of an income statement or a balance sheet is generally…
Q: Going beyond just calculating NPV, discuss it qualitatively. What is it used for? Is it a good…
A: Net present value is defined as the difference between the PV of the cash inflows as well as present…
Q: Answer asap please, With the use of examples, differentiate between: Theoretical expertise and…
A: Sharing and rapid knowledge growth are made easier by information technology. Information technology…
Q: conomics is concerned
A: To explain the correct option as,
Q: Discuss the various kinds of Research Strategies?
A: Research is a system of activity that involves finding out findings which we don’t know. Research…
Q: From where has the concept DU pont Analysis comes?what’s the formula?
A: Ratio Analysis is the method of checking the company's operational efficiency, liquidity, and…
Q: What can be concluded from the provided picture?
A: Statement of cash flow is the one prepared by the company to determine the cash position of the…
Q: Explain in detail, using examples where possible, the difference between hedging, speculation
A: In the world of finance and investments hedging and speculation are important concepts. Many…
Q: What other kinds of comparisons might an analyst make?
A: Ratio analysis, horizontal analysis and vertical analysis are the analytical tools used by the…
Q: What are Required Assumptions and Decision Frameworks for replacement analysis?
A: Replacement analysis: It is an analysis tool in capital budgeting decisions. An asset life tends…
Q: Can you explain why D is the correct answer?
A: Trial balance: A financial statement which integrates all the balance of ledger accounts is termed…
Q: can you be more clear of what the answer is? thanks
A: Given: Beginning of the Year Common Stock = $8 Additional Paid in Surplus = $138 End of the Year…
Q: What is the answer to this question
A: Partnership is the association of two or more individuals who collaborate to conduct a lawful…
Q: f Quantitative Research titles or topics related to Accountancy
A: Quantitative Research titles mean the number based accounting metrics used to conduct research study…
Q: artnership
A: Correct answer :- D 15000
Q: Which statement is correct?
A: A current ratio is one of the ratios used to assess the liquidity of the company. It shows that the…
Q: Which of the following relationships between types of analytical procedures and sources of…
A:
Q: What are the two inputs required in the preparation of the pro forma statements?
A: Pro forma financial statements are reports that are formed based on hypothetical situations in the…
Q: What is materiality? Explain?
A: Materiality: The accounting concept which focusses that all the financial items and figures which…
Q: explain why the author's assessment of the appropriateness of the going concern assumptions is so…
A: Going Concern Assumption- As per the going concern assumption business will continue its…
Q: What are the answers
A: The answer is as fallows
Q: Can you explain each point in detail, if possible?
A: Lets understand the basics. Cash management is must requirement for banks in todays world. This is…
Q: Which of the following statement is correct?
A: Pecking Order Theory: As per this theory, the preference for sources for funds is first retained…
Q: Is the following statement true or false? Explain your answer.
A: Step 1 Portfolio diversification is the act of investing your money across a variety of asset…
Q: For practical applicationsas opposed to theoretical considerations, which ismore relevant, the CML…
A: Security market line (SML) or Capital market line (CML): The capital market line appears the…
Q: What are the Replacement-Analysis Fundamentals?
A: Replacement analysis refers to the process where an organization determines whether it is beneficial…
Q: What can you see from vertical analysis? Or comment briefly on the facts revealed by your analysis.
A: Comparative balance sheet(horizontal approach) means where increase or decrease of every item is…
Q: Which answer is correct and why?
A: Under average cost method, average cost per unit is calculated as: = Total cost of opening inventory…
Q: which is correct from these attached?
A: A cash flow statement is the one prepared as a part of financial statements under which the cash…
Q: Which of the following statements is correct?
A: Accounts payable: the amount that the company should to pay in a specified future date Bad Debt: the…
Q: What is the answer ?
A: Thank you for posting questions. Since you have posted multiple questions, as per the guideline I am…
Q: What does the statement mean?
A: A financial system is a collection of entities that allow money to be exchanged, such as banks,…
Q: What does the EMH imply for the use of technical and fundamental analysis?
A: The efficient market hypothesis (EMH), as a substitute called the efficient market theory. It is a…
Q: What is the answers and how did you arrive at those answers?
A: Cost of production is the cost incurred to produce a definite quantity of product. This cost…
Q: What differential analysis and why would we use it?
A: Decision making is the process of taking the decisions based on the costs and different kind of…
Q: Which of the following is a correct statement?
A: When a sole property dies during the financial year leaving the estate that is known as Deceased…
Q: Which of the following statements is CORRECT?
A: DIVIDEND POLICY Dividend policy is the policy that determines the assigning of earnings into…
Q: Explain Prepayment Assumptions?
A: Prepayment model : In simple words, A prepayment model is employed in banking to forecast the amount…
Q: Why is it more accurate to describe the subject matter of this chapter as CVP analysis rather than…
A: Cost-Volume-Profit Analysis (CVP Analysis): CVP Analysis is a tool of cost accounting that measures…
Q: What is the CAPM? What does it tell you?
A: Capital asset pricing model (CAPM) is a model or method which is used by the company to define the…
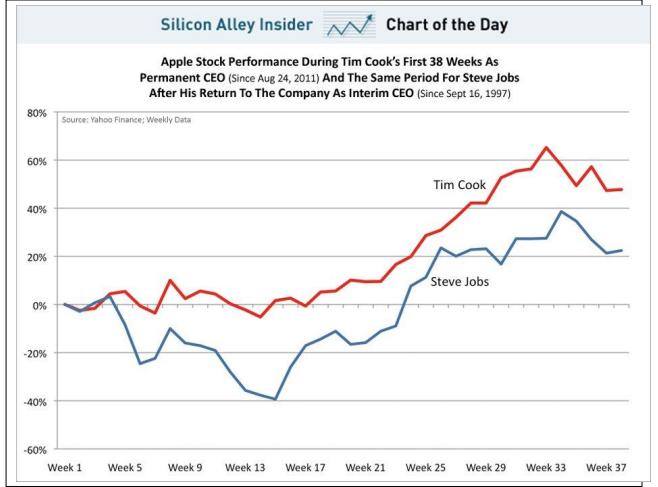
Q: What are the types of fundamental analysis?
A: Fundamental analysis basics is the analyzing method used to evaluate the intrinsic value of stocks…
Would you say this chart is a technical or a fundamental analysis? Give reasons for your
answer?

Step by step
Solved in 3 steps


- On August 1, 2007 the Dell Computer Corporation's stock closed trading at $27.76 per share while Apple Corporation's shares closed at $133.64. Does this mean that because Apple's stock price is roughly four times that of Dell's, Apple is the more valuable company? Interpret the prices for these two firms using the information found here: (Most recent 12 months) Dell 2007 Apple 2007Net Income ($ millions) $3,572 $3,130Shares outstanding (millions) 2,300 869.16Earnings per share ($) $1.55 $3.60Price per share (8/1/07) $27.76 $133.64Price-to-earnings ratio (PE ratio) 17.91 37.11Book value of common equity ($ millions) $4,129 $9,984Book value per share ($) $1.80 $11.49Market-to-book ratio 15.42 11.63 It appears that Apple enjoys a ▼ higher lower price per share when compared to its 2007 earnings but a ▼ higher lower price when compared to the book value of the firm's equity. The ▼ lower higher market-to-book ratio for Apple reflects that fact that…If Baldwin issued 1000 shares of common stock at last year's end price $46.98 , the effect on the balance sheet would be: Select : 1 Retained earnings would increase by $46,984 Equity would decrease by $4,698 Equity would increase by $46,984 Retained earnings would increase by $4,6989. The stockholders’ equity section of Kay Corporation at the end of 2015 showed: (see attached images for the given, someone already answer letter a to c, so please answer letter d to f. please answer it. thank you so much) d. What is the average cost per share of treasury stock? (Round to the nearest cent.) e. What is the revised retained earnings if the net income for the year is P167,000 and total dividends declared is P50,000? f. Present the shareholders’ equity.
- usiness AccountingQ&A LibraryWeisberg Corporation has 10,000 shares of $100 par value, 6%, preference shares and 50,000 ordinary shares of $10 par value outstanding at December 31, 2020. Instructions Answer the questions in each of the following independent situations. a. If the preference shares are cumulative and dividends were last paid on the preference shares on December 31, 2017, what are the dividends in arrears that should be reported on the December 31, 2020, statement of financial position? How should these dividends be reported? b. If the preference shares are convertible into seven shares of $10 par value ordinary shares and 3,000 shares are converted, what entry is required for the conversion, assuming the preference shares were issued at par value? c. If the preference shares were issued at $107 per share, how should the preference shares be reported in the equity section? Weisberg Corporation has 10,000 shares of $100 par value, 6%, preference shares…Using the information for The Great Cookie Company presented in the table below, determine the following: Highest price paid for a share of stock in the last 12 months. The last price paid for a share of stock on this trading day. Lowest price paid for a share of the stock in the last 12 months. Additional Resources Year-to-Date % Change 14.62% EPS $1.13 52-Week Hi $40.20 PE Ratio 31.07 52-Week Lo $28.44 Volume 2,810,000 Dividend $0.88 Close Price $35.11 Yield Percentage 2.51% Net Change 1.07 1. Highest price paid: $ 2. Last price paid: $ 3. Lowest price paid: $Microsoft has a stock price of $60 per share and earnings per share (EPS) of $4.50. The company recently announced a 2-for-1 stock split, and as a result, the number of outstanding shares has doubled. Calculate the new P/E ratio for Microsoft after the stock split. (23/44) b C) d) 4.0 8.0 15.0 20.0 17.0
- Justice Corporation reported the following financial statements: LOADING... (Click the icon to view the financial statements.) The company has 2,900 shares of common stock outstanding and the market price is $25 per share. What is Justice's price/earnings ratio? (Round any intermeidary calculations and your final answer to two decimal places, X.XX.) A. 0.09 B. 8.80 C. 8.80 times D. $0.09 Click to select your answer. Financial Statements Justice Corporation Comparative Balance Sheet December 31, 2025 and 2024 2025 2024 Assets Current Assets: Cash and Cash Equivalents $2,150 $1,724 Accounts Receivable 1,966 1,772 Merchandise Inventory 1,348 1,104 Prepaid Expenses 1,638 2,055 Total Current Assets 7,102 6,655 Other Assets 17,335 16,268 Total Assets $24,437 $22,923 Liabilities Current Liabilities $7,383…Bay Area Supplies had 60,000 shares of common stock outstanding at January (1. On May 1, Bay Areas Supplies issued 31,500 shares of common stock. Outstanding all year were 30,000 shares of nonconvertible preferred stock on which a dividend of P4 per share was paid in December. Net income for the year was P290,100. Bay Area Supplies should report basic earnings per share for the year of Choices; P1.86. P2.10. P2.84. P3.17.Earnings per Share and Price-Earnings Ratio A company reports the following: Net income $530,000 Preferred dividends $30,000 Shares of common stock outstanding 50,000 Market price per share of common stock $87.00 a. Determine the company's earnings per share on common stock. Round your answer to the nearest cent. Use the rounded answer of requirement a for subsequent requirement, if required.$fill in the blank b. Determine the company's price-earnings ratio. Round to one decimal place.fill in the blank
- (Market value analysis)The balance sheet for Larry Underwood Motors shows a book value of stockholders' equity (book value per sharetimestotal shares outstanding) of $ 1,369,000. Furthermore, the firm's income statement for the year just ended has a net income of $ 505,000, which is $ 0.243 per share of common stock outstanding. The price-earnings ratio for firms similar to Underwood Motors is 18.55. a. What price would you expect Underwood Motors shares to sell for? b. What is the book value per share for Underwood's shares? Question content area bottom Part 1 a.What price would you expect Underwood Motors shares to sell for? The market price per share is $4.51.(Round to the nearest cent.) Part 2 b.What is the book value per share for Underwood's shares? The book value per share is $ ??? enter your response here. (Round to the nearest cent.)Calculate the earnings per share (average of 418,000 shares outstanding for the year) for 2020. (Round answer to 2 decimal places, e.g. 2.55.) earnings per share $ 2.31 per share Calculate the price/earnings ratio (market price of $48 at year-end) for 2020. (Round answer to 1 decimal place, e.g. 2.5.) Price/earnings ratio 20.8 Calculate the dividend payout ratio (dividends of $1.25 per common share for the year) for 2020. (Round answer to 1 decimal place, e.g. 2.5.) Dividend payout ratio ? % *I thought the answer was 47.9%, but it says it is not correct!?Calculate the earnings per share (average of 418,000 shares outstanding for the year) for 2020. (Round answer to 2 decimal places, e.g. 2.55.) earnings per share $ 2.31 per share Calculate the price/earnings ratio (market price of $48 at year-end) for 2020. (Round answer to 1 decimal place, e.g. 2.5.) Price/earnings ratio 20.8 Calculate the dividend payout ratio (dividends of $1.25 per common share for the year) for 2020. (Round answer to 1 decimal place, e.g. 2.5.) Dividend payout ratio ? %
