Write down the value of following indices functions: 3 (i) 3 × 5* 125 1 (ii) 162 2 (iii) 125 3
Write down the value of following indices functions: 3 (i) 3 × 5* 125 1 (ii) 162 2 (iii) 125 3

Chapter6: Exponential And Logarithmic Functions
Section6.5: Logarithmic Properties
Problem 2SE: What does the change-of-base formula do? Whyis ituseful when using a calculator?

Related questions
Question
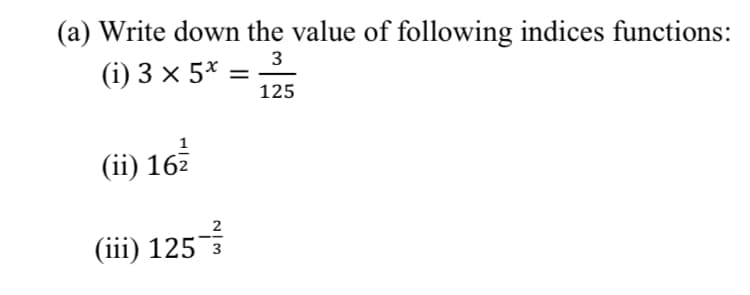
Transcribed Image Text:(a) Write down the value of following indices functions:
3
(i) 3 × 5* :
125
(ii) 162
2
(iii) 125 3
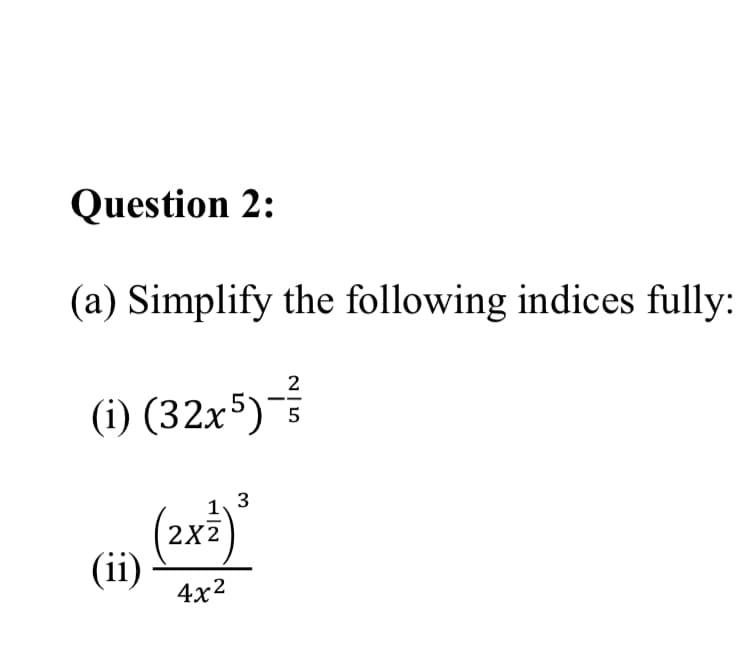
Transcribed Image Text:Question 2:
(a) Simplify the following indices fully:
2
(i) (32x5)
5
(2xi)
1, 3
2X2
(ii)
4x2
Expert Solution
This question has been solved!
Explore an expertly crafted, step-by-step solution for a thorough understanding of key concepts.

Step by step
Solved in 2 steps with 1 images

Recommended textbooks for you