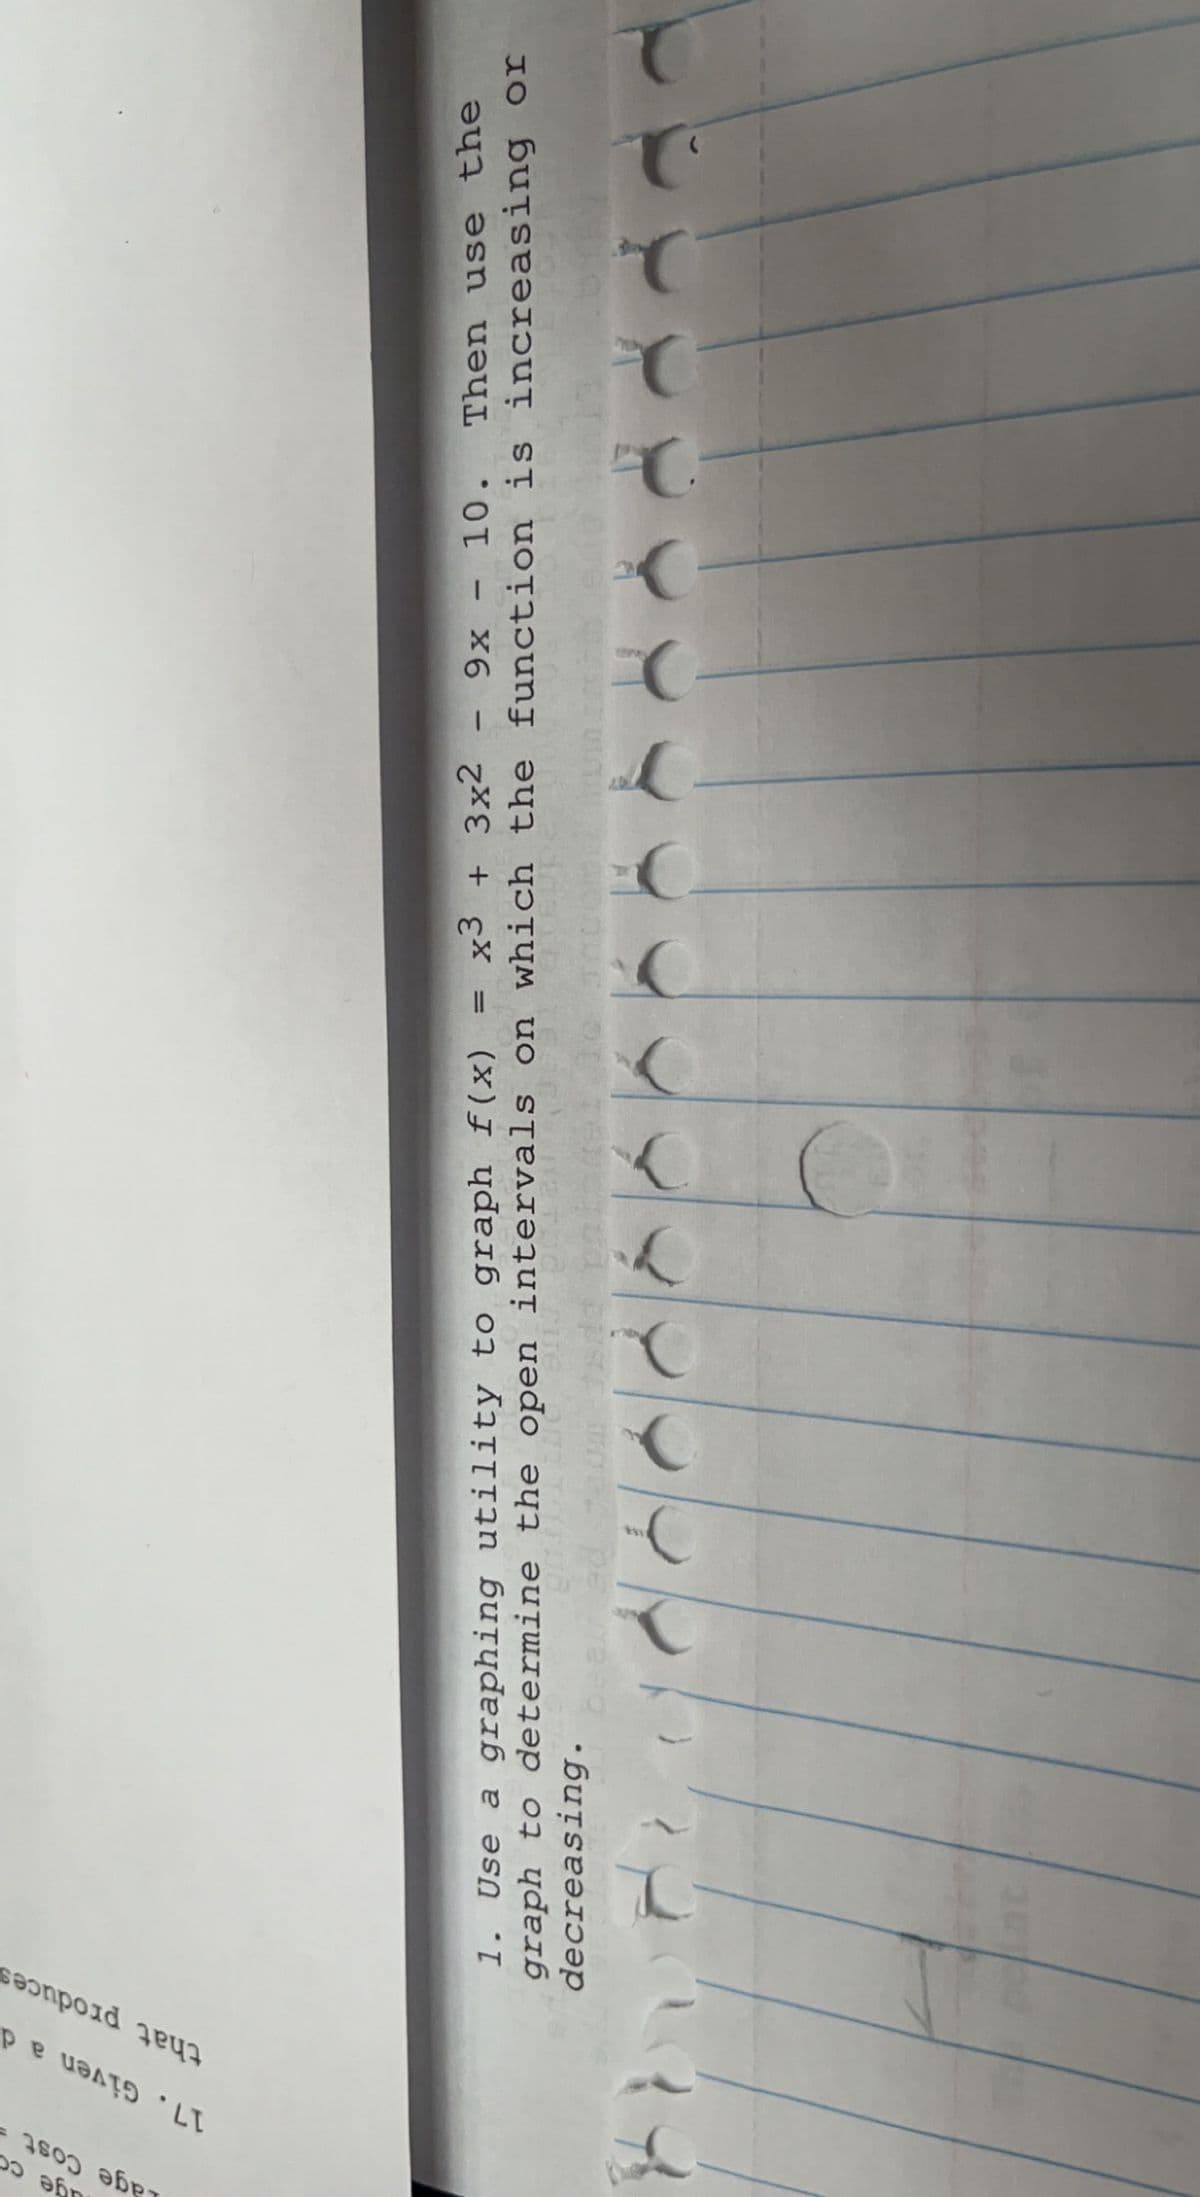
x3 + 3x2 10. Then use the 1. Use a graphing utility to graph f(x) graph to determine the open intervals on which the function is increasing or decreasing. X6
x3 + 3x2 10. Then use the 1. Use a graphing utility to graph f(x) graph to determine the open intervals on which the function is increasing or decreasing. X6
Chapter3: Functions
Section3.3: Rates Of Change And Behavior Of Graphs
Problem 4TI: Graph the function f(x)=x36x215x+20 to estimate the local extrema of the function. Use these to...
Related questions
Question

Transcribed Image Text:Lage Cost =
17. Given ad
that produces
x3 + 3x2
9x - 10. Then use the
1. Use a graphing utility to graph f(x)
graph to determine the open intervals on which the function is increasing or
decreasing.
Expert Solution
This question has been solved!
Explore an expertly crafted, step-by-step solution for a thorough understanding of key concepts.
Step by step
Solved in 3 steps with 1 images

Recommended textbooks for you


Trigonometry (MindTap Course List)
Trigonometry
ISBN:
9781337278461
Author:
Ron Larson
Publisher:
Cengage Learning


Trigonometry (MindTap Course List)
Trigonometry
ISBN:
9781337278461
Author:
Ron Larson
Publisher:
Cengage Learning


Glencoe Algebra 1, Student Edition, 9780079039897…
Algebra
ISBN:
9780079039897
Author:
Carter
Publisher:
McGraw Hill

Algebra for College Students
Algebra
ISBN:
9781285195780
Author:
Jerome E. Kaufmann, Karen L. Schwitters
Publisher:
Cengage Learning