y - tan( 2(x -)) %3D Graph the function. 10

Algebra & Trigonometry with Analytic Geometry
13th Edition
ISBN:9781133382119
Author:Swokowski
Publisher:Swokowski
Chapter4: Polynomial And Rational Functions
Section4.5: Rational Functions
Problem 30E

Related questions
Question
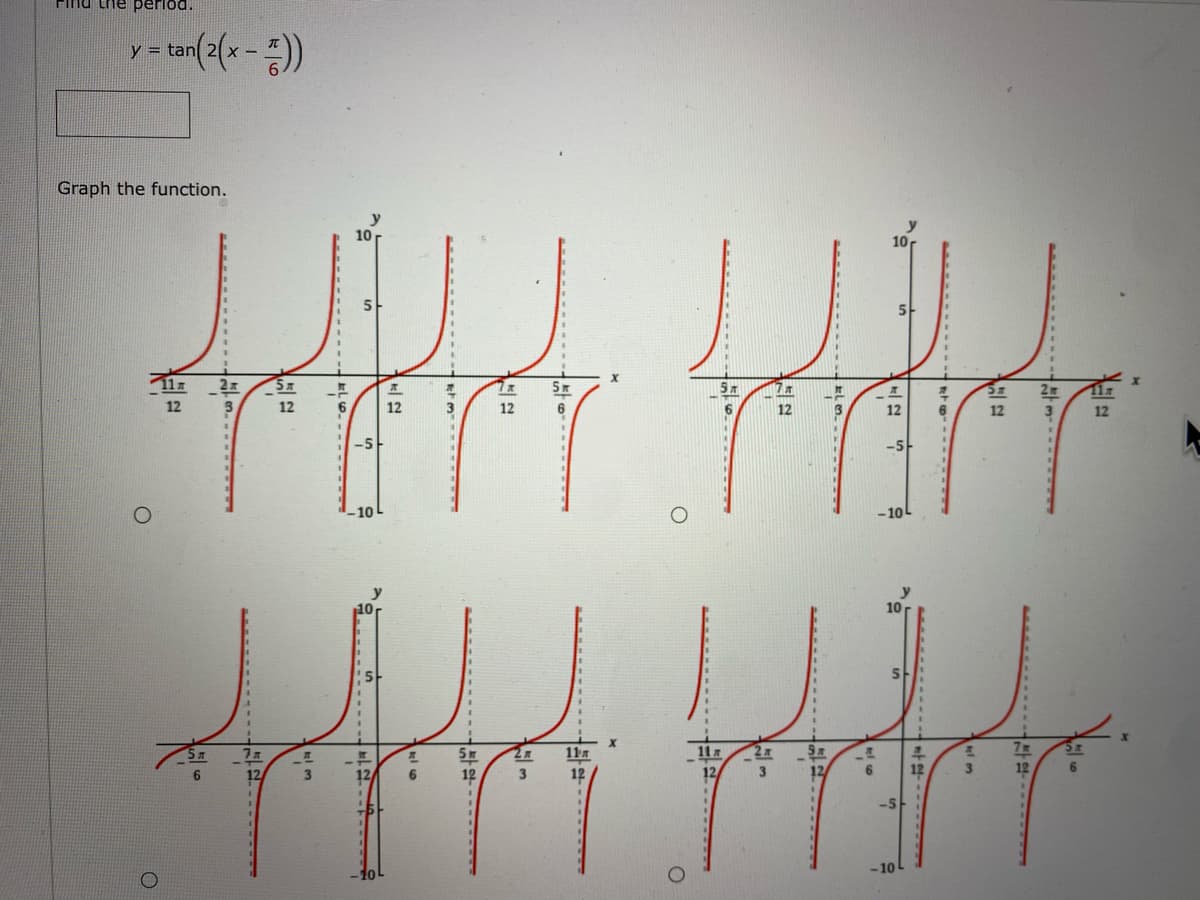
Transcribed Image Text:Finu the perlod.
y - tan(2(x -))
Graph the function.
10r
5-
5m
12
12
12
12
6
12
12
12
12
-5-
-5
10
-10L
10
11
11
12
12
3
12
6
6.
12
-5
-10
Expert Solution
This question has been solved!
Explore an expertly crafted, step-by-step solution for a thorough understanding of key concepts.

Step by step
Solved in 3 steps with 2 images

Recommended textbooks for you
Algebra & Trigonometry with Analytic Geometry
Algebra
ISBN:
9781133382119
Author:
Swokowski
Publisher:
Cengage

Algebra & Trigonometry with Analytic Geometry
Algebra
ISBN:
9781133382119
Author:
Swokowski
Publisher:
Cengage