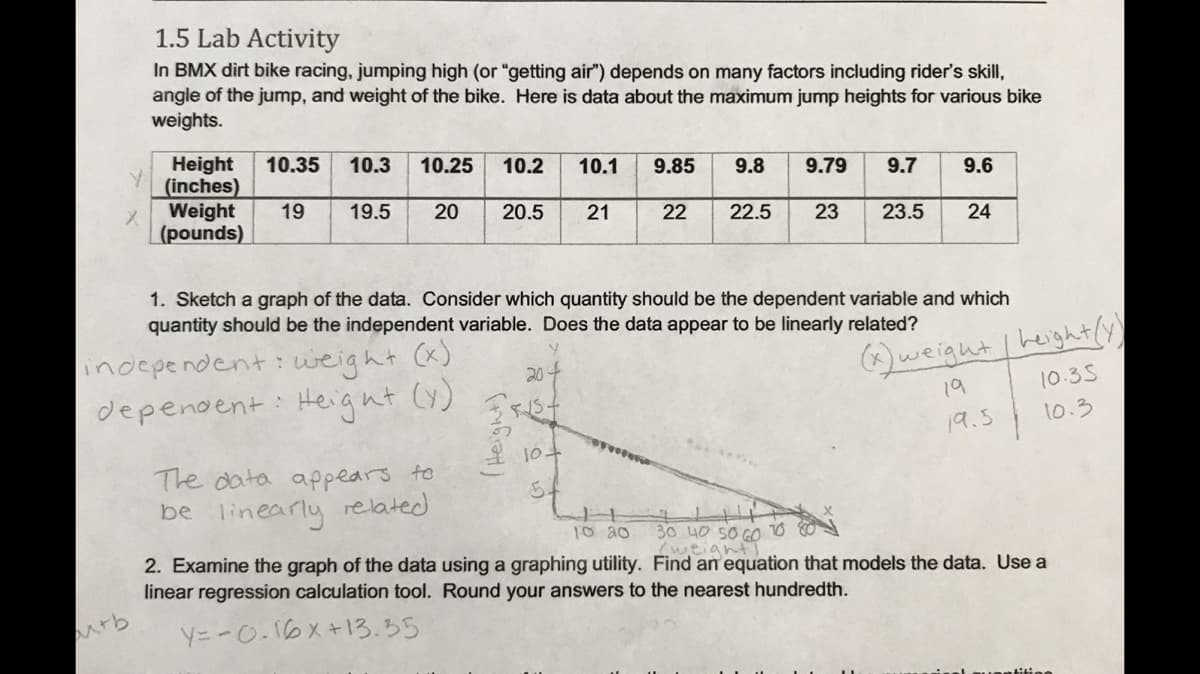
In BMX dirt bike racing, jumping high (or "getting air") depends on many factors including rider's skill, angle of the jump, and weight of the bike. Here is data about the maximum jump heights for various bike weights. Height 10.35 10.3 10.25 (inches) Weight (pounds) 19 19.5 20 ht (x) ependent: weight pendent: Height (y) The data appears to be linearly related 10.2 10.1 9.85 9.8 20.5 21 1. Sketch a graph of the data. Consider which quantity should be the dependent variable and which quantity should be the independent variable. Does the data appear to be linearly related? (x) weight / heigh- 19 19.5 20+ Frist 10. 9.79 9.7 (Height) 22 22.5 23 9.6 23.5 24 10.3 to.3 10 20 30 40 50 60 10 80 (weight" 2. Examine the graph of the data using a graphing utility. Find an equation that models the data. Use a linear regression calculation tool. Round your answers to the nearest hundredth.
In BMX dirt bike racing, jumping high (or "getting air") depends on many factors including rider's skill, angle of the jump, and weight of the bike. Here is data about the maximum jump heights for various bike weights. Height 10.35 10.3 10.25 (inches) Weight (pounds) 19 19.5 20 ht (x) ependent: weight pendent: Height (y) The data appears to be linearly related 10.2 10.1 9.85 9.8 20.5 21 1. Sketch a graph of the data. Consider which quantity should be the dependent variable and which quantity should be the independent variable. Does the data appear to be linearly related? (x) weight / heigh- 19 19.5 20+ Frist 10. 9.79 9.7 (Height) 22 22.5 23 9.6 23.5 24 10.3 to.3 10 20 30 40 50 60 10 80 (weight" 2. Examine the graph of the data using a graphing utility. Find an equation that models the data. Use a linear regression calculation tool. Round your answers to the nearest hundredth.

Chapter3: Polynomial Functions
Section3.5: Mathematical Modeling And Variation
Problem 2ECP

Related questions
Question
I don’t know if I’m doing this correctly. Could you look at problem 1 and 2 to see if I’m doing this correctly?
Thank you,
Ryan
Transcribed Image Text:Y
X
arb
1.5 Lab Activity
In BMX dirt bike racing, jumping high (or "getting air") depends on many factors including rider's skill,
angle of the jump, and weight of the bike. Here is data about the maximum jump heights for various bike
weights.
Height 10.35 10.3
(inches)
19 19.5
Weight
(pounds)
10.25
weight
Height
20
The data appears to
be linearly related
10.2 10.1 9.85
20.5
1. Sketch a graph of the data. Consider which quantity should be the dependent variable and which
quantity should be the independent variable. Does the data appear to be linearly related?
independent:
<+ (x)
dependent:
(y)
21
20+
Erist
2 10+
5
9.8 9.79 9.7 9.6
22 22.5 23 23.5 24
(x) weight / height(y)
19
10.35
19.5
10.3
10 20
30 40 50 60 10
(weight)
2. Examine the graph of the data using a graphing utility. Find an equation that models the data. Use a
linear regression calculation tool. Round your answers to the nearest hundredth.
y=-0.16x +13.35
Expert Solution
This question has been solved!
Explore an expertly crafted, step-by-step solution for a thorough understanding of key concepts.

This is a popular solution!

Trending now
This is a popular solution!

Step by step
Solved in 4 steps with 3 images

Recommended textbooks for you