You are asked to predict weather temperature. You only know the linear regression model and luckily the given samples can be mapped using it. In your given dataset temperature value depends on both humidity and visibility. To execute the tasks, you are given skeleton codes. Write your own code by modifying, updating, inserting code as necessary to estimate a linear equation for the given datasets. Write your code using raw python code. You can use NumPy, pandas, etc. However, you are not allowed to use any high-level API (such as TensorFlow, PyTorch, Maxnet, etc.)


You are asked to predict weather temperature. You only know the linear regression model and luckily the given samples can be mapped using it. In your given dataset temperature value depends on both humidity and visibility. To execute the tasks, you are given skeleton codes. Write your own code by modifying, updating, inserting code as necessary to estimate a linear equation for the given datasets. Write your code using raw python code. You can use NumPy, pandas, etc. However, you are not allowed to use any high-level API (such as TensorFlow, PyTorch, Maxnet, etc.)
get_data () function returns the data and split it into training and test set. Write data_iter() function to create batch-wise data and return batches as needed during your training.
You are fitting these data samples using a linear equation. Write a function create_model_parameter(mu, sigma, row, column) to create the parameters and initialize values with normal random values. mu and sigma represent mean and standard deviation, respectively.
Write a code for the linear regression given as model() function in the skeleton code.
Compute loss function using squared_loss() function.
Compute gradient using gradient() function for each parameter of your model.
Update you model parameter using sgd() function
Write your train() function to execute your linear regression for all the samples given.
Draw a single figure for training loss vs number epochs for three different batch sizes. Write your own function by modifying draw_loss(). Please choose batch sizes as small, large, and just exact. Explain the effect of batch sizes on the training loss.
Skeleton code:
import numpy as np
import pandas as pd
from sklearn.model_selection import train_test_split
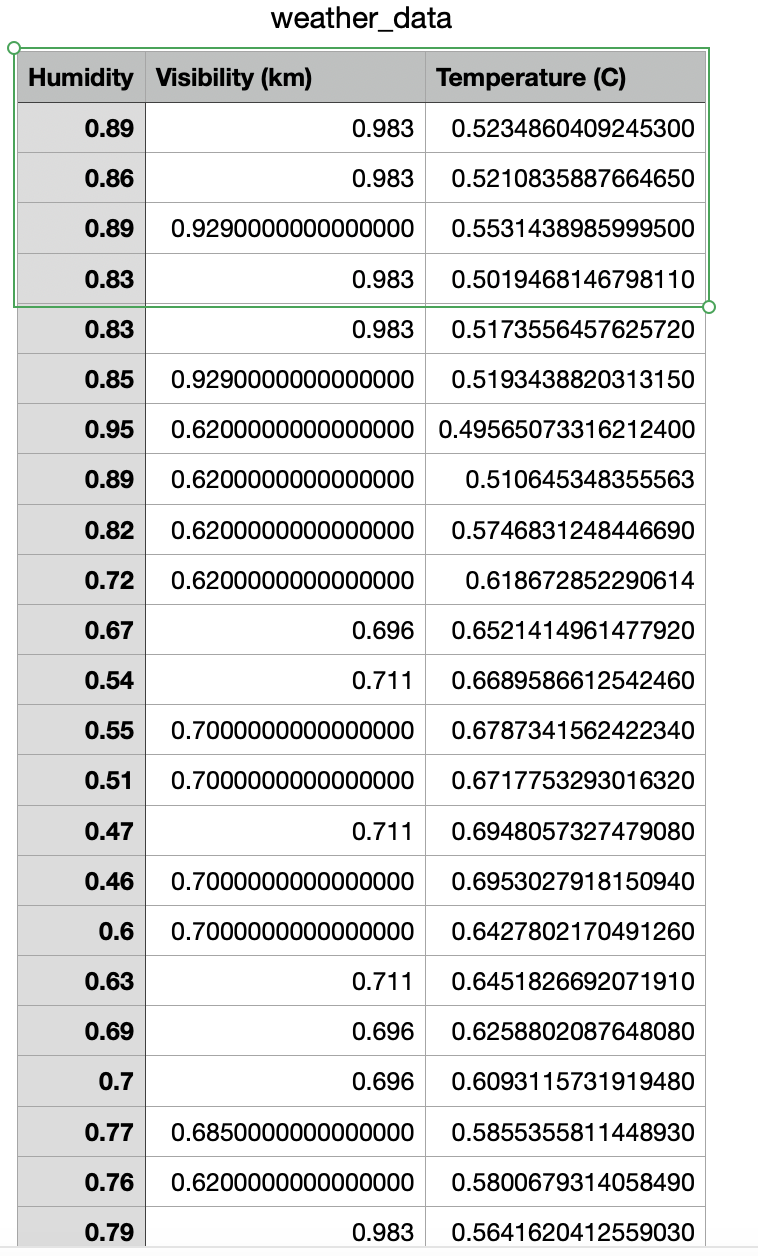
datafile = "cleaned_data/weather_data.csv"
def get_data(filename):
df = pd.read_csv(filename)
X_ = df[["Humidity","Visibility (km)"]]
Y_ = df[["Temperature (C)"]]
# Spliting data into train and test sets
X_train, X_test, y_train, y_test = train_test_split(X_, Y_, test_size=0.25, random_state=42)
return X_train, X_test, y_train, y_test
X_train, X_test, y_train, y_test = get_data(datafile)
print(X_train.shape, X_test.shape, y_train.shape, y_test.shape)
def data_iter(batch_size, X, y):
num_examples = len(X)
indices = list(range(num_examples))
# The examples are read at random, in no particular order
random.shuffle(indices)
for i in range(0, num_examples, batch_size):
#write your code here to retrun batch wise X,y
batch_size = #define your batch size
for X, y in data_iter(batch_size, features, labels):
print(X, '\n', y)
break
create and initialize model p..#@save
"""Squared loss."""
#write your code here for loss function
return
def gradient(loss,params):
#compute gradeint of loss function with respect to params
return
def sgd(params, grads, lr, batch_size): <..#@save
"""Minibatch stochastic gradient descent."""
#write your code for updating your parameter using gradient descent
#Example: theta = theta - (lr * grad)/batch_size
def train(lr,num_epochs,X,y):
# write your own code and modify the below code as needed
for epoch in range(num_epochs):
for X, y in data_iter(batch_size, X, y):
train_l = loss(net(features, w, b), labels)
print(f'epoch {epoch + 1}, loss {float(tf.reduce_mean(train_l)):f}')
return epoch, loss
def draw_loss(num_epochs,loss):
plt.plot(num_epochs,loss)
plot.show()
def test(X):
# write your own code
#predict temperature for the given humidity and visibility
Example of DataFile in screenshot
This is just what the data looks like. Actual data has 96430 lines.
Please write the code in jupyter.


Trending now
This is a popular solution!

Step by step
Solved in 2 steps

Please show detailed answer before I give feedback


