You are conducting a study to see if the proportion of voters who prefer the Democratic candidate is significantly different from 80% at a level of significance of a = 0.05. According to your sample, 68 out of 88 potential voters prefer the Democratic candidate. a. For this study, we should use z-test for a population proportion b. The null and alternative hypotheses would be: Ho: (p) (please enter a decimal) H₁: (p (Please enter a decimal) c. The test statistic (z)✓ (please show your answer to 3 decimal places.) d. The p-value = (Please show your
You are conducting a study to see if the proportion of voters who prefer the Democratic candidate is significantly different from 80% at a level of significance of a = 0.05. According to your sample, 68 out of 88 potential voters prefer the Democratic candidate. a. For this study, we should use z-test for a population proportion b. The null and alternative hypotheses would be: Ho: (p) (please enter a decimal) H₁: (p (Please enter a decimal) c. The test statistic (z)✓ (please show your answer to 3 decimal places.) d. The p-value = (Please show your

A First Course in Probability (10th Edition)
10th Edition
ISBN:9780134753119
Author:Sheldon Ross
Publisher:Sheldon Ross
Chapter1: Combinatorial Analysis
Section: Chapter Questions
Problem 1.1P: a. How many different 7-place license plates are possible if the first 2 places are for letters and...

Related questions
Question
B C and D only
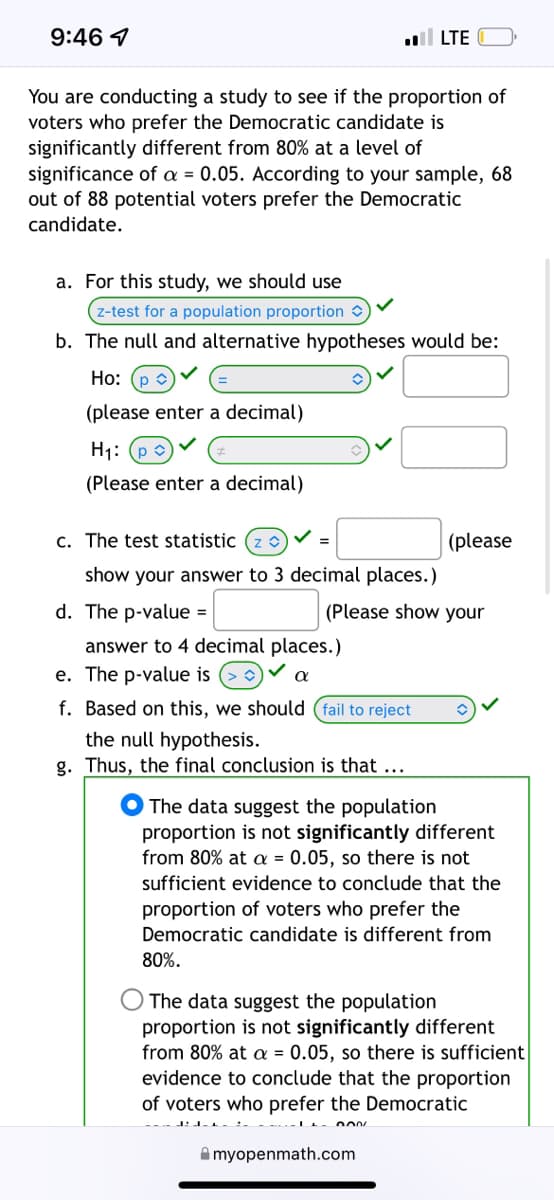
Transcribed Image Text:9:46 7
..llLTE
You are conducting a study to see if the proportion of
voters who prefer the Democratic candidate is
significantly different from 80% at a level of
significance of a = 0.05. According to your sample, 68
out of 88 potential voters prefer the Democratic
candidate.
a. For this study, we should use
z-test for a population proportion
b. The null and alternative hypotheses would be:
Ho: (p
(please enter a decimal)
H₁: (p
(Please enter a decimal)
c. The test statistic (z)
(please
show your answer to 3 decimal places.)
d. The p-value =
answer to 4 decimal places.)
e. The p-value is
α
f. Based on this, we should (fail to reject
the null hypothesis.
g. Thus, the final conclusion is that ...
(Please show your
The data suggest the population
proportion is not significantly different
from 80% at a = 0.05, so there is not
sufficient evidence to conclude that the
proportion of voters who prefer the
Democratic candidate is different from
80%.
The data suggest the population
proportion is not significantly different
from 80% at a = 0.05, so there is sufficient
evidence to conclude that the proportion
of voters who prefer the Democratic
-1000
myopenmath.com
Expert Solution
This question has been solved!
Explore an expertly crafted, step-by-step solution for a thorough understanding of key concepts.

This is a popular solution!

Trending now
This is a popular solution!

Step by step
Solved in 4 steps with 2 images

Recommended textbooks for you
A First Course in Probability (10th Edition)
Probability
ISBN:
9780134753119
Author:
Sheldon Ross
Publisher:
PEARSON

A First Course in Probability (10th Edition)
Probability
ISBN:
9780134753119
Author:
Sheldon Ross
Publisher:
PEARSON