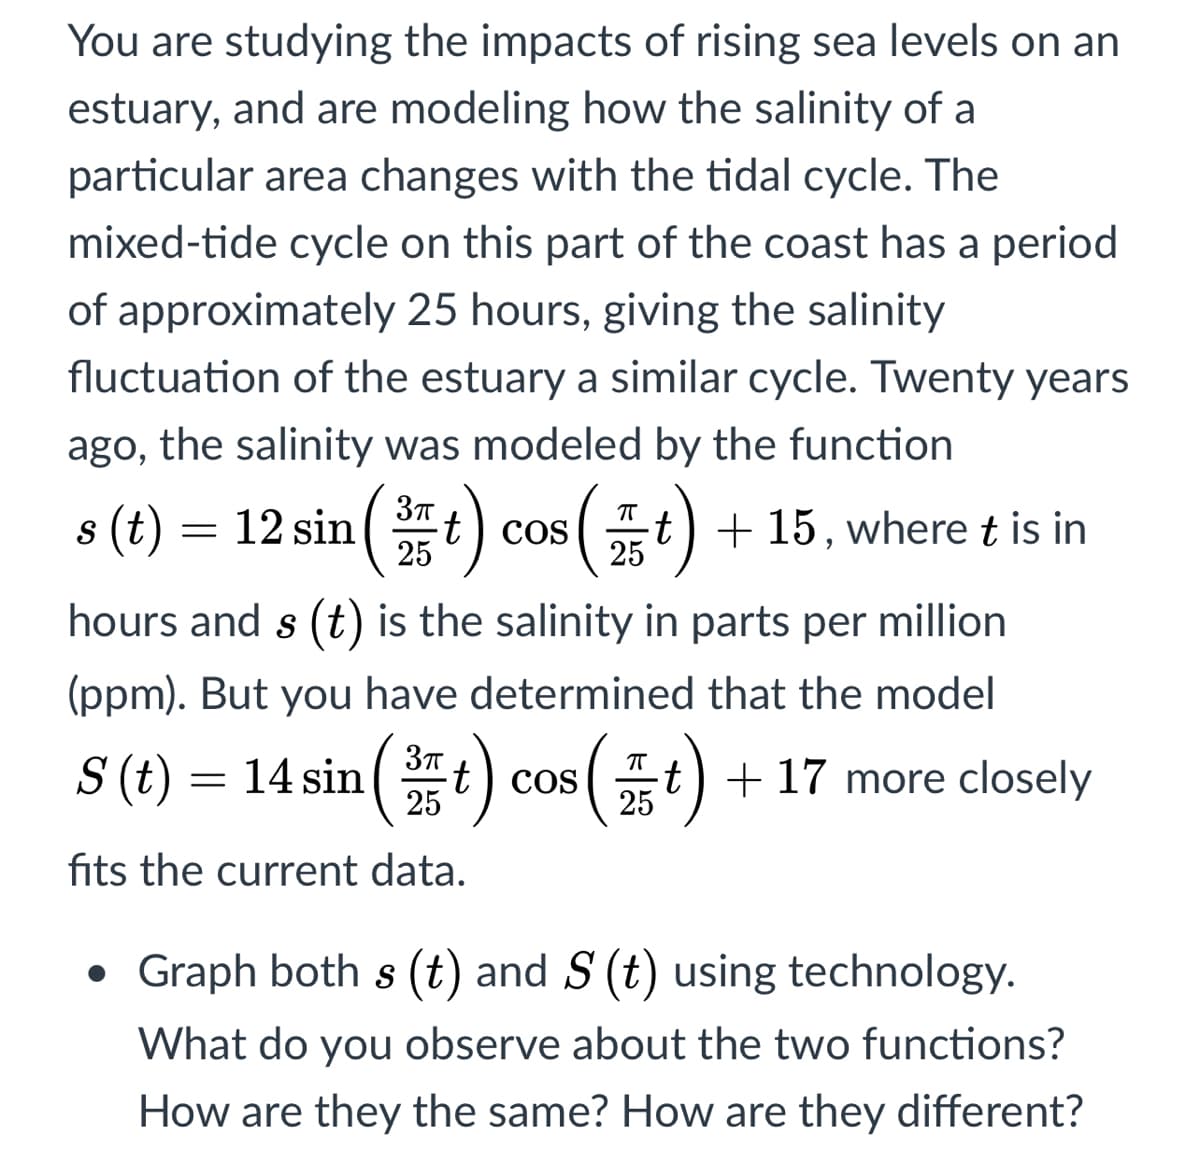
You are studying the impacts of rising sea levels on an estuary, and are modeling how the salinity of a particular area changes with the tidal cycle. The mixed-tide cycle on this part of the coast has a period of approximately 25 hours, giving the salinity fluctuation of the estuary a similar cycle. Twenty years ago, the salinity was modeled by the function s (t) = 12 sin t) -t) + 15, where t is in 25 25 hours and s (t) is the salinity in parts per million (ppm). But you have determined that the model S (t) = 14 sin (t) cos t ) cos 25 + 17 more closely 25 fits the current data. • Graph both s (t) and S (t) using technology. What do you observe about the two functions? How are they the same? How are they different?
You are studying the impacts of rising sea levels on an estuary, and are modeling how the salinity of a particular area changes with the tidal cycle. The mixed-tide cycle on this part of the coast has a period of approximately 25 hours, giving the salinity fluctuation of the estuary a similar cycle. Twenty years ago, the salinity was modeled by the function s (t) = 12 sin t) -t) + 15, where t is in 25 25 hours and s (t) is the salinity in parts per million (ppm). But you have determined that the model S (t) = 14 sin (t) cos t ) cos 25 + 17 more closely 25 fits the current data. • Graph both s (t) and S (t) using technology. What do you observe about the two functions? How are they the same? How are they different?

Functions and Change: A Modeling Approach to College Algebra (MindTap Course List)
6th Edition
ISBN:9781337111348
Author:Bruce Crauder, Benny Evans, Alan Noell
Publisher:Bruce Crauder, Benny Evans, Alan Noell
Chapter2: Graphical And Tabular Analysis
Section2.1: Tables And Trends
Problem 1TU: If a coffee filter is dropped, its velocity after t seconds is given by v(t)=4(10.0003t) feet per...

Related questions
Question
Transcribed Image Text:You are studying the impacts of rising sea levels on an
estuary, and are modeling how the salinity of a
particular area changes with the tidal cycle. The
mixed-tide cycle on this part of the coast has a period
of approximately 25 hours, giving the salinity
fluctuation of the estuary a similar cycle. Twenty years
ago, the salinity was modeled by the function
s (t) = 12 sin(t
t) cos
25
t) + 15, where t is in
25
hours and s (t) is the salinity in parts per million
(ppm). But you have determined that the model
S (t) = 14 sin (t) cos (t) + 17 more closely
25
25
fits the current data.
Graph both s (t) and S (t) using technology.
What do you observe about the two functions?
How are they the same? How are they different?
Expert Solution
Given

Trending now
This is a popular solution!

Step by step
Solved in 3 steps with 1 images

Recommended textbooks for you
Functions and Change: A Modeling Approach to Coll…
Algebra
ISBN:
9781337111348
Author:
Bruce Crauder, Benny Evans, Alan Noell
Publisher:
Cengage Learning

Trigonometry (MindTap Course List)
Trigonometry
ISBN:
9781337278461
Author:
Ron Larson
Publisher:
Cengage Learning

Functions and Change: A Modeling Approach to Coll…
Algebra
ISBN:
9781337111348
Author:
Bruce Crauder, Benny Evans, Alan Noell
Publisher:
Cengage Learning
Trigonometry (MindTap Course List)
Trigonometry
ISBN:
9781337278461
Author:
Ron Larson
Publisher:
Cengage Learning

Linear Algebra: A Modern Introduction
Algebra
ISBN:
9781285463247
Author:
David Poole
Publisher:
Cengage Learning