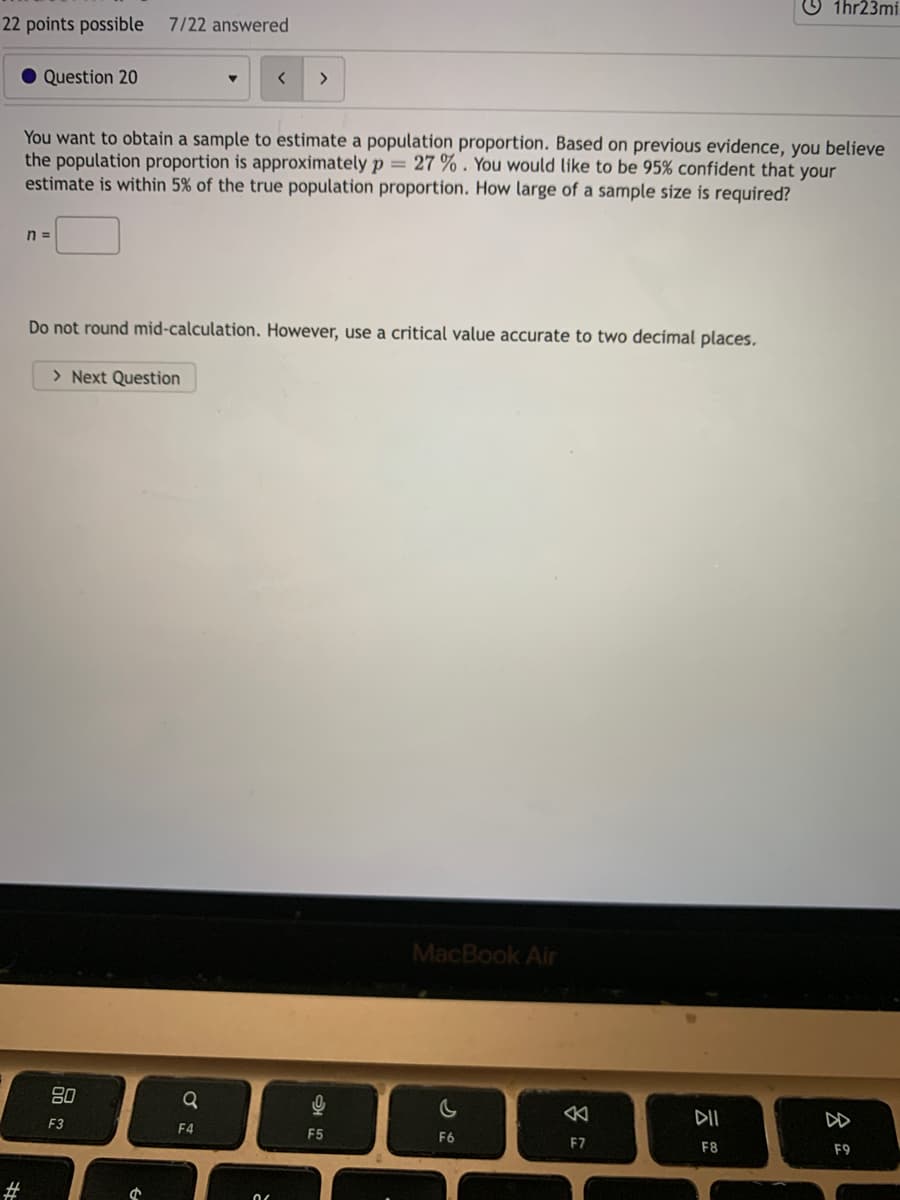
You want to obtain a sample to estimate a population proportion. Based on previous evidence, you believe the population proportion is approximately p = 27 % . You would like to be 95% confident that your estimate is within 5% of the true population proportion. How large of a sample size is required? %3D n = Do not round mid-calculation. However, use a critical value accurate to two decimal places.
Q: Example 16.13) A person while calculating correlation coefficient between two variables X and Y ob-…
A:
Q: Based on historical data, your manager believes that 33% of the company's orders come from…
A: It is given that n =89 and p =0.33.
Q: Five people are in an endurance race. Suppose you randomly pick and bet on two of them. What is the…
A: According to the classical definition of probability, the probability of an event is the ratio of…
Q: Persistence diagrams show the behaviour of drivers over the last few years across different…
A:
Q: If A and B are complements, then which of the following is true about the probability of B based on…
A:
Q: (d) Find P(A|A N B). (e) Find P(A N B|A U B).
A: It is given that P(A) =0.4, P(B)=0.2 and P(A∩B)=0.1.
Q: ---Food Koala delivers the customer's orders on time 60% of the time. Suppose 7 deliveries were made…
A: 8) Given: 60% of the time food Koala delivers orders on time. Sample size is 7. Each delivery is…
Q: You can use the Distribution Calculators page in SALT to find critical values and/or p-values to…
A: Use the Excel and Perform the Regression. Followings are the Steps to perform the Regression 1) Open…
Q: 18. A Mexican tfood truck knows from past data that 60% of customers order the beef taco instead of…
A: Given,n=10p=0.6q=1-0.6=0.4A random variable X~Binomial(n=10 , p=0.6)P(X=x)=Cx0.6x0.410-x ;…
Q: 3. Dwight Howard has a free throw percentage of 56.5% which means he successfully makes a free throw…
A: Given , Dwight Howard has a free throw percentage of 56.5% i.e. Probability of making successful…
Q: You are working for a bank and your supervisor asked you to predict the default risk for cach of the…
A:
Q: 2.) Find the probability that an event E will occur if odds are 5:2 in favor of E.
A:
Q: The work week for adults in the US that work full time is normally distributed with a mean of 47…
A: Given that Hours 45 40 54 54 45 68 48 58 49 50 50 55 Population mean =47 hours We have to conduct…
Q: O T O Statistics and Probability 11. Let 1.2.... be a sequence of iid zero-mean random variables.…
A:
Q: Write a symbolic description of the following shaded area. Use the symbols P, M, n, U, -, and' as…
A:
Q: 4. Let X1 and X2 be random samples from a standard normal distribution, answer the following…
A:
Q: In a class of students, the following data table summarizes how many students have a cat or a dog.…
A:
Q: Determine the areas under the normal curve given the mean of the distribution u = 80 and o = 5.5,…
A: Hello! As you have posted more than 3 sub parts, we are answering the first 3 sub-parts. In case…
Q: A boxcar contains six complex electronic systems. Two of the six are to be randomly selected for…
A:
Q: ph school graduates are randomly selecte ution? Whenever possible, give the values he number of…
A: The probability distribution of this discrete random variable having x number of successes in n…
Q: Question9: Choose one answer. Which of the following random variables is NOT continuous? 1) Amount…
A: According to guidelines we solve only first question when given question are different.
Q: Now that the degrees of freedom and sum of squares column values have been determined, we can…
A: Given: SST = 170.969 SSE = 846.017 Number of treatment (k) = 4 Size of population (N) = 74
Q: L Directions: Solve the given probiem below, Show your complete solution. Use the space provided.…
A: Population is the whole set of observation used for study. Sample is the subset of population and…
Q: (A) Find the probability that a randomly selected U.S. female is taller (B) Take a random sample of…
A:
Q: Given π = 39.4% and ? = 585 above, the fraction of sample proportions that fall within ±0.03 (3…
A:
Q: possibte The table below shows the educational attainment of a country's population, aged 25 and…
A:
Q: A jar contains 3 red balls and 3 blue balls. One ball is drawn from the jar, its color is recorded,…
A: From the provided information, A jar contains 3 red balls and 3 blue balls. Total balls = 3 + 3 = 6
Q: 7 (a) Seven men and five women need to sit down for dinner at a circular table. (1) In how many ways…
A: Given that, Seven men and five women need to sit down for dinner at a circular table. We need to…
Q: 2. Let X be a continuous random variable with density f(x) = 3(1- x)²,0 <x < 1. Determine the PDF…
A: Solution
Q: Problem 2.6: A continuous joint probability distribution is expressed through the following…
A: Since you have posted a question with multiple sub-parts, we will solve first three subparts for…
Q: A bag contains five red marbles, two orange marbles, one yellow marble, and two green marbles. Two…
A: Ans - A bag contains five red marbles, two orange marbles, one yellow marble, and two green marbles.…
Q: A. Determine whether the distribution represents a probability distribution. Explain your answer. 7.…
A: As per our guidelines we are suppose to answer only one questionA) Properties of probability…
Q: 9. A card is drawn from a deck of 52 cards. If the suit of the card is a heart or a spade, a fair…
A: Given information: Number of cards in the deck = 52 cards Number of hearts in the deck = 13 Number…
Q: It is known that the errors of laboratory tests to identify COVID-19 is 5%, with this data find the…
A: Given that n=70,p=0.05
Q: 13. The variable X measures the time it takes for a delivery truck to complete a route. The mean…
A: Given Mean(μ)=100standard deviation(σ)=18
Q: II. SAMPLING AND SAMPLING DISTRIBUTIONS Assume that the systolic blood pressure of 30-year-old males…
A:
Q: the arrows landed. What is the probability distribution table of the variable random variable X?
A: here given , Two archery with number 3,5 and 8 here there are three color in each archery and…
Q: Assume that a sample is used to estimate a population mean u. Find the margin of error M.E. that…
A:
Q: An article in the Journal of Sound and Vibration (Vol. 151, 1991, pp. 383-394) described a study…
A: The following information has been given: x y 60 1 63 0 65 1 70 2 70 5 70 1 80 4…
Q: 7, 12, 33, 33, 34, 37, 38, 40, 40, 41, 47, 51 2. The sample mean is about (а) 34.00 (b) 12.30 (c)…
A:
Q: Find the area that corresponds to each of the following z-value: 1. z = 0.3 2. z = 1.96 3. z = -1.15
A:
Q: You have constructed the following 95% confidence interval about the population mean: [80, 100] This…
A: We have given that, The 95% confidence interval about population mean (μ) is [80, 100]. This…
Q: For a standard normal distribution, find: P(-0.94 z<-0.65) Question Help: Video 1 D Video 2 Submit…
A:
Q: Two students from a statistics class are chosen at random and tested to see if they have any math…
A:
Q: (a) Find the mean and variance of X. (b) Use normal approximations to binomial random variables to…
A: here given , Suppose 500 people audition for admission to a dance school. Each dancer in one half of…
Q: 2. ,Two distinct octahedrons (eight-sided die) are rolled. What is the probability that t.e sum of…
A: 2) Two distinct eight sided die are rolled. The objective is to find the probability that: (a) Sum…
Q: A popular brand of pen is available in 10 colors and 4 writing tips. How many different cholces of…
A:
Q: Continuous Distributions - Data Management The marks in a physics class have a mean of 79 and a…
A: formula for z-score is
Q: A student does a survey to see if the proportions of men and women who plan to get a degree in a…
A: Given that - A student does a survey to see if the proportions of men and women who plan to get a…
Q: 10.1. Expected Values of Sums of Random Variables (1) Let the joint probability density function of…
A:
Step by step
Solved in 2 steps with 2 images
- You want to obtain a sample to estimate the proportion of a population that possess a particular genetic marker. Based on previous evidence, you believe approximately p∗=87% of the population have the genetic marker. You would like to be 99% confident that your estimate is within 5% of the true population proportion. How large of a sample size is required? n= (Do not round mid-calculation, use a critical value accurate to three decimal places.)medical researcher says that less than 79% of adults in a certain country think that healthy children should be required to be vaccinated. In a random sample of 200 adults in that country, 75% think that healthy children should be required te vaccinated. At a=0.01, is there enough evidence to support the researcher's claim? Complete parts (a) through (e) below. (b) Find the critical value(s) and identify the rejection region(s). Identify the critical value(s) for this test (Round to two decimal places as needed. Use a comma to separate answers as needed.) Identify the rejection region(s). Select the correct choice below and fill in the answer box(es) to complete your choice. (Round to two decimal places as needed.) O A. The rejection region is z>. O B. The rejection regions are z< and z> O C. The rejection region is <z< O D. The rejection region is z< (C) Find the standardized test statistic z. (Round to two decimal places as needed.) (d) Decide whether to reject or…An experiment has been conducted to investigate the effects of carbon monixide in the breathing capability of human. The claim was breathing frequency is higher in the presence of CO. The data shows the result of the experiment (see picture). Assume that the breathing frequency is approximately normal. a) What should be the good hypotheses for this problem? b) At 0.05 level, what is the critical region? c) What is the t-value/z-score? d) Is the claim true at 0.05 level?
- A study was done to compare the birth weight of newborn babies from the general population to a group of 24 babies born to mothers who smoked during pregnancy. The researcher was testing her prediction of an average lower birth weight for babies born to smokers. The mean birth weight in the population was reported to be 3.5 kg and birth weight in the sample was M = 3.0 kg. Results from the t-test used in data analysis showed a t-value = 5.35, p = .02. No calculations are required here. Type in your answers to the following questions in the space below. 1) which of the 3 t-tests is the proper one to use? 2) Write the Null and Alternative Hypotheses for this study in a sentence, including the value of mu. 3) Write an APA conclusion for this study to report the results. This sentence should include the IV and DV, significance, APA stats, and the M.Determine the null and alternative hypotheses. Identify the test statistic, r. Identify the critical value(s). (Round to three decimal places as needed.) State the conclusion.If the researchers and sides to test this hypothesis at a = 0.01 level of significance, determine the critical values. The critical values are_. Use a comma to separate answers as needed. Round to three decimal places as needed.
- The data shown in Table 6E.2 are x and R values for 24 samples of size n = 5 taken from a process producing bearings. The measurements are made on the inside diameter of the bearing, with only the last three decimals recorded (i.e., 34.5 should be 0.50345). (a) Set up x and R charts on this process. Does the process seem to be in statistical control? If necessary, revise the trial control limits. (b) If specifications on this diameter are 0.5030+/- 0.0010, find the percentage of nonconforming bearing produced by this process. Assume that diameter is normally distributed.Having the variation data regression line r=0.931 and the calculated coefficient of determination of 0.867.. And explained variation of the data of 86.7%.. About the unexplained variation? [ ] % of the variation is unexplained and is due to other factors or to sampling error. (Round to one decimal place as needed.)The personality trait of "Conscientiousness" (someone who is organized, responsible, and can control their impulses) has μ = 120 and σ =9. Test whether ARC students (n = 9, M = 126) differ on Conscientiousness. α = .05. Does the z score for the sample mean lie in the critical region (beyond the critical boundary)?
- A random survey of 90 women who were victims of violence found that 24 were attacked by relatives. A random survey of 60 men found that 10 were attacked by relatives. At a=0.05. can it be shown that the percentage of women who were attacked by relatives is different from the percentage of men who were attacked by relatives? Compute the test value. Round sample proportions to three decimal places and z score values to two decimal places. Find the critical values. Do we reject or not reject the null hypothesis?The mean of a population of raw scores is 33 (Sx =12). Our sample has X 36.8 (N = 30). Using the .05 criterion and the upper tail of the sampling distribution: (a) What is the critical value? (b) Is the sample mean in the region of rejection? How do you know? (c) What does the mean’s location indicate about the likelihood of this sample occurring in this population? (d) What should we conclude about the sample? *ANSWER ALL PARTS OF QUESTION*The chi square statistics please answer and show work on solving x2 critical value and x2