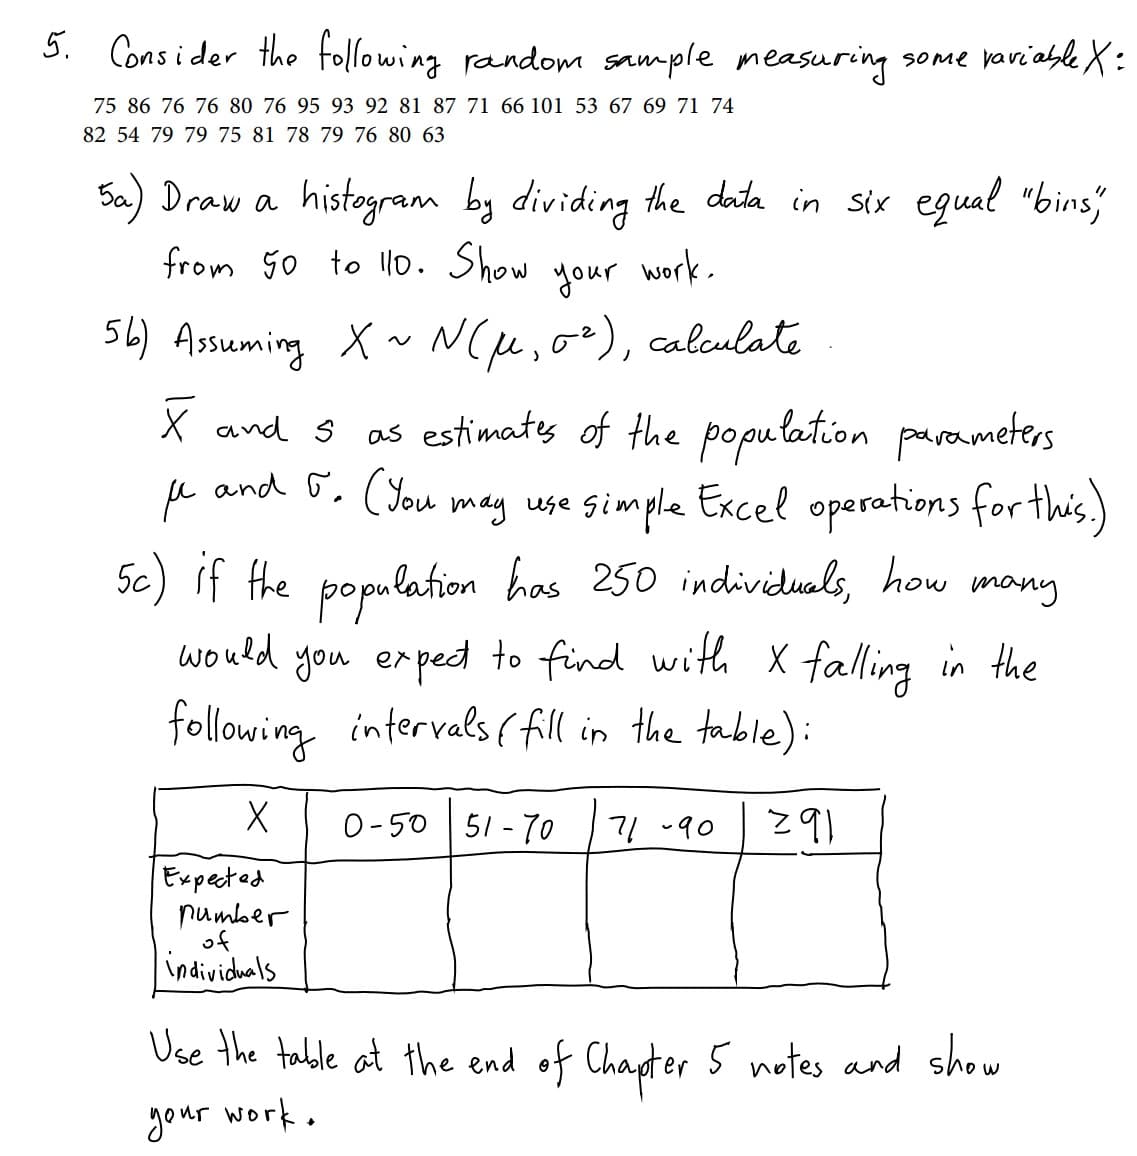
your estimated distribution of X, calan- bate the probability that a randomly drawn individual from a population of 250 shows Value of X between 65 and 70. 5d) Using


Q: Is this function harmonic? 2x + y³ – 3x?y a. Yes O b. No O c.Not at all O d. all of the above
A: coreect option is a. YES
Q: 1. Solve each of the linear congruence equations or verify that it has no solution. (i). 3r = 4(mod ...
A:
Q: (a) The first 3 terms of an arithmetic progression are ?, 5?, 7? − 4. Find (i) the value of ?, (i...
A:
Q: (a) Find the gradient, x and y intercepts for the equation, x = y + 2.
A:
Q: (b) Find the LU factorization of the matrix: 1 -1 A= 3 -4 -2 | 2 -3 -2
A: The given matrix is A=1-1-13-4-22-3-2 We have to find the LU factoriz...
Q: What is the measurement of the missing angle? Explain
A: To find the missing angle in the given figure.
Q: Maximize z= 4x +3y エ+5y S 25 4x + y < 24 Subject to Maximum is Preview at Preview Preview VI VI ALAI...
A: Draw the given constraints to find the feasible area.
Q: te the integral I = Include 4 decimal places ox +6x+10 single application of the trapezoidal rule, m...
A: Consider the function f(x)=1x2+6x+10. The interval of integration is [0,1]. Therefore the change of ...
Q: 10r1 - 12 9. -21 + 10x2 – 2.r3 -2.x2 + 10x3 O76
A:
Q: 1
A:
Q: solve for the unknown terms by the method of: 100 100 100 100 4 -1 1 X1 |-1 X2 4 -1 1 -1 4 -1 X3 1 -...
A: The given system of equations written in the matrix form are as follows:-4-1010-14-1010-14-1010-14-1...
Q: 2s - 1 43. s2 - 6s + 18
A:
Q: Suppose that the functions u and w are defined as follows. u (x) =-x-1 w (x) =? %3D Find the followi...
A:
Q: The graph below show's Leslie's monthly budget. Leslie's Monthly Budget other savings 11% 10% rent e...
A: Given- The graph below show's Leslie's monthly budget. To find- Which of the following are not true...
Q: Determine the location of the centroid of the solid formed by revolving about the y-axis, the area b...
A:
Q: Cave paintings were discovered in Bandelier, NM. The paint contained 28% of the original carbon-14. ...
A:
Q: A company is considering two insurance plans with coverage and premiums shown. It needs at least $15...
A: Let units purchased for policy A = x units Let unity purchased for policy A = y units
Q: The error is numerically computing the integral | 1 dx using the +4 trapezoidal rule with two interv...
A:
Q: (а) п! —D О(п") (b) n" + 0(n") (c) log2(n!) = 2(n log2 n)
A:
Q: Write the equation of the circle that has a diameter with the following endpoints: (-4,2) and (2,6).
A: Given that the diameter with the end points −4,2 and 2,6. We have to find the equation of a circle t...
Q: solve laplace problem 3y^'-4y=sin2t, y(0)=1/3
A:
Q: if xo = 2, x1 = 3 and x2 = 4 the second degree %3| polynomial for f(x) = using Lagrange Interpolatio...
A: Given function is f(x)=12and the nodes are x0=2, x1=3 and x2=4. We have to find second degree Lagran...
Q: Jamie had 6\frac{1}{2}621 dozens of cookies. She sold 3\frac{2}{6}362 dozen of the cookies she mad...
A:
Q: . Compute the Legendre symbols. -22 ), (i). (). (i). (5). (iv). (). (i). 19 127 179
A:
Q: Question 1. Are the following matrices similar? 3 2 a) 1 and ? YES NO -1 0 ? 0 6 -1 2 b) and YES NO ...
A:
Q: If the given function is constant, which of the Fourier Coefficients is/are zero? O an and by O an o...
A:
Q: Determine the area inside of r = 3+2 sin e and outside of r = 2. Sketch the region.
A:
Q: Find all the solutions to sinh z = 0
A: Introduction: There is an exponential expression for the hyperbolic function. The expressions for si...
Q: Question 2: (a) Insert 4 arithmetic means between 1 and 15. (b) Insert 5 geometric means between 3 a...
A: To find- Insert 4 arithmetic means between 1 and 15. Insert 5 geometric means between 3 and 192.
Q: H.WSolve et -et 2.
A:
Q: The solution of the differential equation x*y" - 2xy' + 6y = 0 (x > 0) is the function y(x) = C; y;(...
A: Put y=xλ in the given differential equation. x2d2xλdx2-2xddxxλ+6xλ=0 This equation reduce into λ2xλ...
Q: Match the solution curve with one of the differential equations. y" + 2y' + 2y = 0 o y" + 2y' + y = ...
A: From the given solution curve we see that the curve is periodic with a period of 2π.
Q: Consider the following all-integer linear program. Маx 1x1 + 1x2 s.t. 4x1 + 7x2 s 31 1x, + 6х, s 18 ...
A: 1st we need to find optimal solution by using corner point method ( Lp relaxation ) . if solution co...
Q: Solve the differential equation (r² + 1)/ – 2ry – 2x = 0 using the (a) method of separation of varia...
A: Given: x2+1y'-2xy-2x=0 To solve: The given differential equation by, (a) method of separation of var...
Q: 1. Using the Newton method evaluate 2x* + 24x³ + 61x² – 16x + 1 = 0. Let the initial guess X, 0.9
A:
Q: (a) the boy con only make UP pnd Right moves anly he de food? the How many parths (b) If he mandemly...
A: We will use basic logic to answer both parts. Note that in the question post, only two parts named (...
Q: 7. How many 10 bit strings have an equal number of 0's and 1's? How many have 8 (and only 8) consecu...
A:
Q: ly for 8 ye
A: In this question, the concept of compound interest is applied. Compound Interest Compound interest i...
Q: ,400 in an account growing at a rate allowing the money to double every 6 years. How much money woul...
A: Introduction: The formula for the growth function is given by, A=A0ert Where A0 is the Initial amoun...
Q: selve the followig system usig Jacabiitecation me thod use xs (o.s o.sos toXt
A:
Q: 1. The sum of two numbers is 45. The first number is twice as large as the second number. What are t...
A: We have to find the two numbers from the given data.
Q: At what point of the curve y = x* is the normal line parallel to 2x + y = 3? 2 16 ㅇ (, ) (뚜 든) 이 o (...
A: To find The point of the curve y=x^4 is the normal line parallel to 2x+y=3.
Q: (c) Determine with justification whether each of the following functions R → R is one-to-one, onto o...
A:
Q: tronics store offers to finance hase of any single item with zero year, with a down payment of $60 e...
A: Introduction: First-order equations are linear equations. Lines in the coordinate system have linear...
Q: Find the transform. Show the details of your work. Assume that a, b, w, 0 are constants. cos" wt * s...
A:
Q: A company plans to purchase a large piece of machinery with $2401 semi-annual payments for 23 months...
A: Given:- Semi-annual payment of machinery =$2401 semi-annual payments for time =23 months...
Q: Question 3. Let {G 1 а 0 1 c: a,b, c e Q 0 0 1 H = %3D under matrix multiplication. Notice that H is...
A: We will use the basic knowledge of group theory to answer both parts of this question.
Q: Find an explicit formula for the sequence of the form a1, a2, a3, . . . with the initial terms given...
A:
Q: Find the Maclaurin/Taylor series of the following problems. Show your complete solution.
A: This is a problem of Maclaurin's Theorem.
Q: Solve the systems of linear congruence equations.
A:
please answer the question in the attached picture with work shown, thanks!
#5 D

Step by step
Solved in 2 steps with 2 images

- assume that the data was obtained from two indepen-dent samples. That is, 28 subjects were enrolled into the study, and half were randomly assignedto the corn flakes diet, and half to the oat bran diet. After two weeks the LDL cholesterol level ofeach individual was recorded. LDL (mmol/l)Subject Corn Flakes Oat Bran1 4.61 3.842 6.42 5.573 5.40 5.854 4.54 4.805 3.98 3.686 3.82 2.967 5.01 4.418 4.34 3.729 3.80 3.4910 4.56 3.8411 5.35 5.2612 3.89 3.7313 2.25 1.8414 4.24 4.14 Questions; a) What are the appropriate null and alternative hypotheses for a two-sided test?(b) Conduct the test at the 0.05 level of significance. What is the p-value?(c) Construct a 95% confidence interval.The following table shows the number of shirts by sizes that are manufactured in a factory on aparticular week:Extra Small Small Medium Large Extra Large390 470 520 680 440 Determine the level of measurement that describes the following (i) The size of the shirt that a customer purchased(ii) The total amount paid by the customer(iii) The address of the factory that manufactures the shirts A machine packages shirt in bags with a mean weight of 3 kg. A random sample of 20 bagshas a mean weight of 3.05 kg with a standard deviation of 0.05kg, From the data given, state the value of a(i) parameter [1](ii) statisticThe lengths (in kilometers) of a random sample of 18 rivers on the South Island of New Zealand that flow to the Pacific Ocean are listed in table below. Lengths of Rivers (in km) 136 121 322 209 208 98 160 66 97 56 90 48 167 64 72 93 288 138 For the data shown above, find the following. Do not round any of your answers. The program here will take either answer.a) Find the 5-number summary: { ,,,, } b) Compute the IQR. Put your answer in the first box and the correct units in the second box. c) What is the lower fence for this data set? What is the upper fence for this data set? d) Which of the following is the correct modified boxplot for the data? What units would go on each of your answers above?
- 1. Determine the missing values represented by W, X, Y, and Z.A W = 118; X = 102; Y = 35 450 and Z = 6 923 750B W = 102; X = 118; Y = 32 450 and Z = 8 923 750C W = 105; X = 115; Y = 32 450 and Z = 8 923 750D W = 102; X = 118; Y = 37 450 and Z = 6 923 7502.Using the sample data in Table 1 above, determine the mean daily consumption of water. A 244.1lB 262.9lC 240.9lD 252.3l3. Using the sample data in Table 1 above, determine the median daily consumption of water.A 243.1lB 241.5lC 247.9lD 238.3lA popular theory is that presidential candidates have an advantage if they are taller than their main opponents. Listed are heights (in centimeters) of randomly selected presidents along with the heights of their main opponents. Complete parts (a) and (b) below. Height (cm) of President 191 182 179 183 200 174 Height (cm)of Main Opponent 183 185 178 181 184 176 a. Use the sample data with a 0.01significance level to test the claim that for the population of heights for presidents and their main opponents, the differences have a mean greater than 0 cm. In this example, μd is the mean value of the differences d for the population of all pairs of data, where each individual difference d is defined as the president's height minus their main opponent's height. What are the null and alternative hypotheses for the hypothesis test? Identify the test statistic. t= Identify the P-value. P-value = What is the conclusion based…The lengths (in kilometers) of a random sample of 20 rivers on the South Island of New Zealand that flow to the Tasman Sea are listed in table below. Lengths of Rivers (in km) 121 68 56 108 56 32 32 177 64 80 64 35 37 80 56 64 72 72 76 48 For the data shown above, find the following. Do not round any of your answers. The program here will take either answer.a) Find the 5-number summary: { ,,,, } b) Compute the IQR. Put your answer in the first box and the correct units in the second box. c) What is the lower fence for this data set? What is the upper fence for this data set? d) Which of the following is the correct modified boxplot for the data? What units would go on each of your answers above?
- A popular theory is that presidential candidates have an advantage if they are taller than their main opponents. Listed are heights (in centimeters) of randomly selected presidents along with the heights of their main opponents. Complete parts (a) and (b) below. Height (cm) of President 177 172 180 184 189 181 Height (cm) of Main Opponent 162 189 165 176 181 173 a. Use the sample data with a 0.05significance level to test the claim that for the population of heights for presidents and their main opponents, the differences have a mean greater than 0 cm. In this example, μd is the mean value of the differences d for the population of all pairs of data, where each individual difference d is defined as the president's height minus their main opponent's height. What are the null and alternative hypotheses for the hypothesis test? Identify the test statistic. Identify the P-value. b. Construct the confidence interval…Following is the data related to the daily production of the two factories of same product located in two different states. Factory Daily Production Factory 1 66 66 73 83 74 73 73 69 82 71 73 66 67 80 79 78 Factory 2 66 63 71 65 65 67 57 48 71 73 68 58 62 81 60 62 72 72 57 77 68 Calculate the value of pool standard deviation (Sp), degree of freedom in the light of part “b” and SED