Your line manager, Ms Lionheart, has collected and scrutinised performance data for the company. She was concerned that the inventories were high for certain products which had resulted in significant price reductions and losses for the company. At the same time, the company had run out of stock for other items early in the season resulting in unsatisfied customers and lost sales. Ms Lionheart has concluded that the problem was not with the specific products carried in the stock, but with the quantities ordered by the procurement department for two popular products; Dog Ball Launcher and Lightweight Dog Lead. Dog Ball Launcher is a product carried by the company for the past four years. Quarterly demand data for the past four years are shown in table 1. Last year the company seemed to always be out of stock for this item. The model used by the procurement department to forecast demand for this product over the last two years has been Multiplicative Seasonal model based on seasonal indices developed using data from 2018‐2019 with predicted annual demand increase of 6 units per year since 2019. Lightweight Dog Lead is a new product that the company has been selling for the past two years. When the product was introduced in 2020, it was expected to have a large increasing demand trend. The procurement team has been using Trend Projection with least‐squares method developed using data from 2020 to forecast the demand for this item. However, they now seem to have too much inventory for this product. Monthly demand data for the past two years for this item is shown in table 2. Ms Lionheart now wonders if right forecasting models were being applied to these two products. She wants you to analyse the available data and produce a short report (1,000 words ± 10%) with all relevant tables and figures, to address the highlighted issues. In your report you need to consider the following for both sets of data: 1. Analyse and explain the data. 2. Is appropriate forecasting model being applied? Explain. 3. What forecasting model would you use? Explain why you selected your approach. 4. Generate the forecast for each period in 2020 and 2021 using the current model and the model you selected. Analyse the results. 5. Determine the forecast error for the current model and the model you selected. Explain your method and findings. 6. Provide three key recommendations for the company. q= quater 2018: q1: 10 q2: 29 q3: 26 q4: 15 2019: q1:14 q2:31 q3: 29 q:18 2020 q1: 20 q2: 26 q3: 28 q3: 30 2021 q1: 30 q2: 31 q3: 33 q4: 35


Your line manager, Ms Lionheart, has collected and scrutinised performance data for the company. She was concerned that the inventories were high for certain products which had resulted in significant price reductions and losses for the company. At the same time, the company had run out of stock for other items early in the season resulting in unsatisfied customers and lost sales. Ms Lionheart has concluded that the problem was not with the specific products carried in the stock, but with the quantities ordered by the procurement department for two popular products; Dog Ball Launcher and Lightweight Dog Lead. Dog Ball Launcher is a product carried by the company for the past four years. Quarterly demand data for the past four years are shown in table 1. Last year the company seemed to always be out of stock for this item. The model used by the procurement department to forecast demand for this product over the last two years has been Multiplicative Seasonal model based on seasonal indices developed using data from 2018‐2019 with predicted annual demand increase of 6 units per year since 2019. Lightweight Dog Lead is a new product that the company has been selling for the past two years. When the product was introduced in 2020, it was expected to have a large increasing demand trend. The procurement team has been using Trend Projection with least‐squares method developed using data from 2020 to forecast the demand for this item. However, they now seem to have too much inventory for this product. Monthly demand data for the past two years for this item is shown in table 2. Ms Lionheart now wonders if right
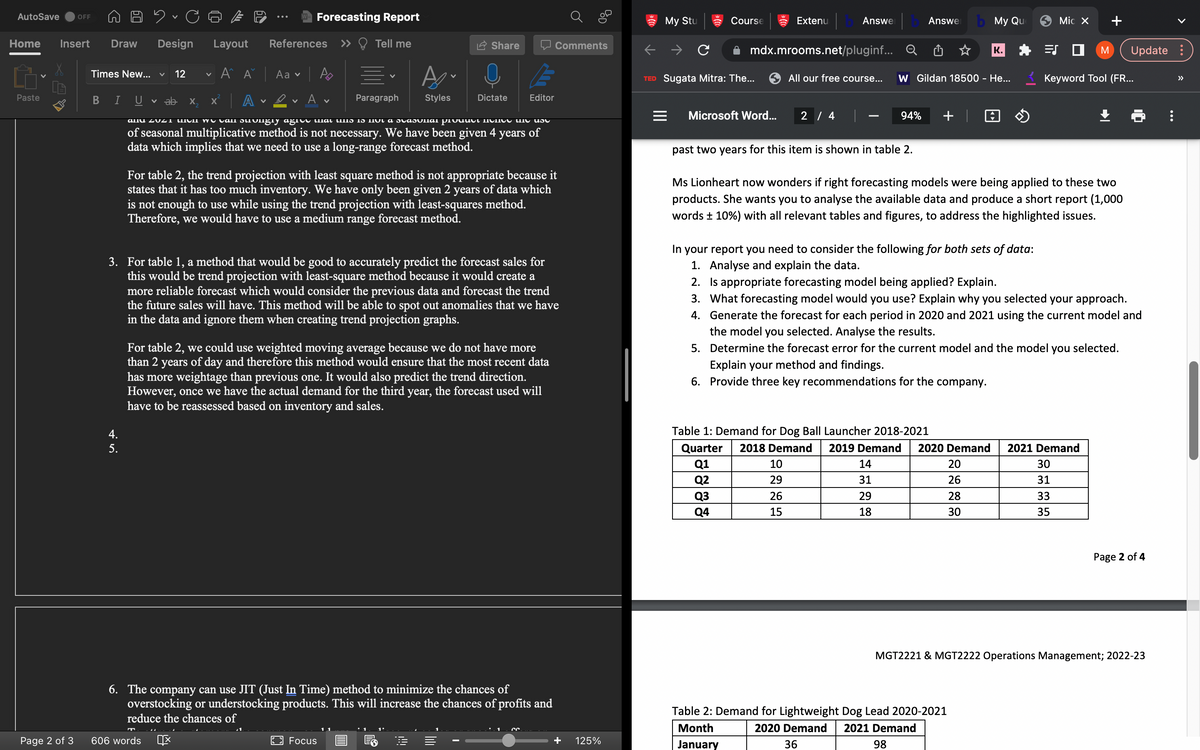
q= quater
2018: q1: 10 q2: 29 q3: 26 q4: 15
2019: q1:14 q2:31 q3: 29 q:18
2020 q1: 20 q2: 26 q3: 28 q3: 30
2021 q1: 30 q2: 31 q3: 33 q4: 35

Step by step
Solved in 3 steps with 8 images


