. A fitness trainer decided to track the combined weight loss of several new customers. She recorded the combined weight loss each month and kept track for 6 months. Identify the best mathematical model with its corresponding R value and tell whether it is a good model. Month 2 9.
. A fitness trainer decided to track the combined weight loss of several new customers. She recorded the combined weight loss each month and kept track for 6 months. Identify the best mathematical model with its corresponding R value and tell whether it is a good model. Month 2 9.

Algebra & Trigonometry with Analytic Geometry
13th Edition
ISBN:9781133382119
Author:Swokowski
Publisher:Swokowski
Chapter7: Analytic Trigonometry
Section7.6: The Inverse Trigonometric Functions
Problem 93E

Related questions
Topic Video
Question
100%
Identify the best mathematical model and it's r^2 value. Is it a good fit?
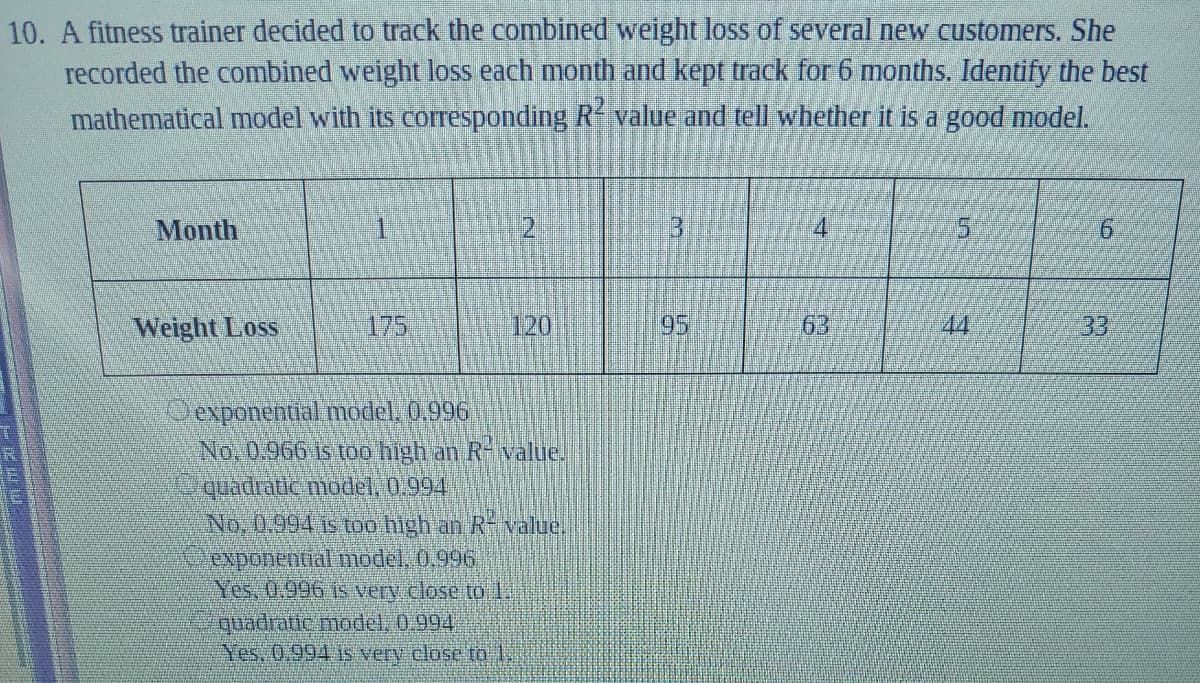
Transcribed Image Text:10. A fitness trainer decided to track the combined weight loss of several new customers. She
recorded the combined weight loss each month and kept track for 6 months. Identify the best
mathematical model with its corresponding R value and tell whether it is a good model.
Month
1.
3.
4.
9.
Weight Loss
175
120
95
63
44
33
exponential model, 0.996
No, 0.966 is too high an R value.
quadratic nmodel, 0.994
No, 0.994 is too high an R value.
exponential model, 0.996
Yes, 0,996 is very close tol.
quadratic model, 0.994
Yes. 0.994 is very close to l,
Expert Solution
This question has been solved!
Explore an expertly crafted, step-by-step solution for a thorough understanding of key concepts.

This is a popular solution!

Trending now
This is a popular solution!

Step by step
Solved in 2 steps with 2 images

Knowledge Booster


Learn more about
Need a deep-dive on the concept behind this application? Look no further. Learn more about this topic, statistics and related others by exploring similar questions and additional content below.Recommended textbooks for you
Algebra & Trigonometry with Analytic Geometry
Algebra
ISBN:
9781133382119
Author:
Swokowski
Publisher:
Cengage
Algebra & Trigonometry with Analytic Geometry
Algebra
ISBN:
9781133382119
Author:
Swokowski
Publisher:
Cengage