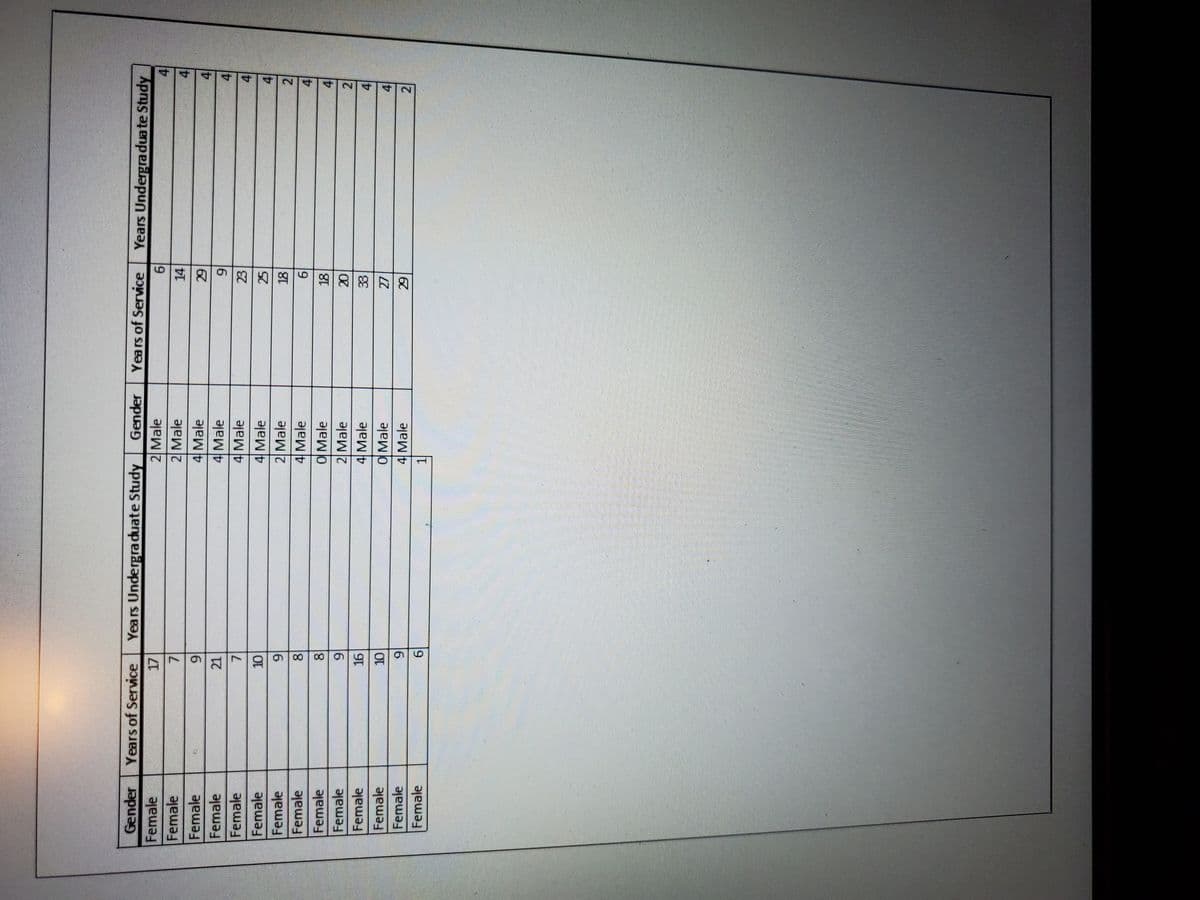
. Is there sufficient evidence at the 0.05 level of significance that the average years of undergraduate study is the same for males and females? Determine the null hypothesis, Ho, and the alternative hypothesis, H, Let females be population 1 and males be population 2 Ho


Q: A researcher was interested in studying if there is a significant relationship between the severity…
A: Since you have posted a question with multiple sub-parts, we will solve first three subparts for…
Q: Test the claim that the proportion of people who own cats is larger than 90% at the 0.01…
A:
Q: Consider the following hypothesis test. H0: μ1 − μ2 = 0 Ha: μ1 − μ2 ≠ 0 The following results are…
A: Solution: a. State the hypotheses. Null hypothesis: Alternative hypothesis:
Q: Medical researchers are studying a certain genetic trait found in two populations of people, W and…
A:
Q: The test statistic of z = 1.53 is obtained when testing the claim that p 0.414. a. Identify the…
A:
Q: A researcher was interested in studying if there is a significant relationship between the severity…
A: For concluding if a relationship between blood type and level of severity, the Chi-square test…
Q: Suppose a group of 700 smokers (who all wanted to give up smoking) were randomly assigned to receive…
A: From the provided information,
Q: Consider the following Hypothesis test: Ho: p=.20 Ha: p≠.20 A sample of 400 provided a sample…
A: Solution: Here, we have to use one sample z test for the population proportion. The null and…
Q: The test statistic of z 1.12 is obtained when testing the claim that p>0.3. a Identify the…
A: (a). Null and alternative hypotheses: The investigator is specifically interested to test the claim…
Q: For the following ANOVA null hypothesis: U= P2=P3= H4= P5, The number of treatments in this…
A:
Q: Test the claim that the proportion of people who own cats is smaller than 10% at the 0.025…
A:
Q: Ha:p0.25Ha:μ>0.25 H0:p=0.25H0:p=0.25 Ha:p>0.25Ha:p>0.25 The test is: left-tailed two-tailed…
A: Given that n=400 , X=80 , p=25%=0.25 Note: According to bartleby experts question answers…
Q: What conclusion can be drawn from the following given? Ho: µ= 30.5 Ha: u< 30.5 o=3.4 x=28.6 n = 42…
A:
Q: The following are six observations collected from treatment 1, four observations collected from…
A: It is given that there are six observations collected from treatment 1, four observations collected…
Q: The following MINITAB output presents the results of a hypothesis test for a population proportion…
A: Hi! Thank you for posting the question. Since your question has more than three sub-parts, we have…
Q: 3. Which of the following problem statements indicate the use of a double-sided hypothesis test? A.…
A: Any assumption about the parameter or probability function is known as hypothesis testing. for the…
Q: n order to determine whether or not there is a significant difference between the hourly wages of…
A: The null hypothesis for this test is there is no difference between the hourly wages of two…
Q: 2. Using the data provided in question 1, assume now that the data was obtained from two indepen-…
A: It is been asked to test whether the mean LDL cholesterol level between corn flakes diet and oat…
Q: Consider the following hypothesis test. Họ: H 1 - 4 2 = 0 Hạ: 4 1- 4 2 * 0 The following results are…
A: Given : H0: μ1 - μ2 = 0 Ha : μ1-μ2≠0
Q: Find the P-value that corresponds to the given standard score, and determine whether to reject the…
A:
Q: A study was conducted to determine the effect of a special diet on a person's cholesterol level. The…
A: Given:
Q: A random sample of 10 professional athletes produced the following data where X is the number of…
A: Solution: The data on X: the number of endorsements the player has and Y: the amount of money made…
Q: The test statistic of z 1.98 is obtained when testing the claim that p 0.607. a Identify the…
A:
Q: Under what circumstances can you use a z-test instead of a t-test to compare a sample against a…
A: t test and z-test are the statistical tests that are used to find if the value of the sample mean is…
Q: Consider the following hypothesis test. Ho: µ1 – µ2 = 0 H: µi – H2 7 0 The following results are for…
A: Given Data : For Sample 1 x̄1 = 104.0 σ1 = 8.4 n1 = 80 For Sample 2…
Q: Test the claim that the proportion of men who own cats is smaller than 80% at the 0.01 significance…
A:
Q: The test statistic of z= 1.19 is obtained when testing the claim that p> 0.3. a. Identify the…
A: a. Different null and alternative hypotheses can be defined as given below Two tailed test: Left…
Q: The test statistic of z = 1.41 is obtained when testing the claim that p> 0.8. a. Identify the…
A:
Q: Test the claim that the proportion of people who own cats is significantly different than 40% at the…
A: It is given that:
Q: Test the claim that the proportion of men who own cats is significantly different than 40% at the…
A: Given, Sample size = 25 Sample proportion = 0.32
Q: Question 12: Test the claim that the proportion of men who own cats is larger than 50% at the .005…
A:
Q: Test the claim that the proportion of men who own cats is significantly different than 60% at the…
A: The researcher claims that the proportion of men who own cats is significantly different than 60%.
Q: The following information is available for two samples drawn from independent normally distributed…
A: The degrees of freedom for population A is n-1 = 10-1 =9.
Q: The worldwide market share for a web browser was 20.1% in a recent month. Suppose that a sample of…
A:
Q: The recommended daily dietary allowance for zinc among males older than age 50 years is 15 mg/day.…
A: We have given that Sample size n =116 Sample mean = 12.5 Standard deviation =6.35 Level of…
Q: Test the claim that the proportion of men who own cats is significantly different than 80% at the…
A: The claim is that the proportion of men who own cats is significantly different than 80%. The…
Q: Test the null hypothesis H0:μ=3.9 against the alternative hypothesis HA:μ≠3.9 based on a random…
A:
Q: A researcher wishes to see whether there is any difference in the weight gains of athletes following…
A: Given data: Diet A Diet B Diet C 3 10 8 6 12 3 7 11 2 4 14 5 8 6…
Q: Consider the following hypothesis test. Ho: µ 1 - µ 2 0 he following results are for two…
A: Given Information: Null Hypothesis: H0:μ1-μ2≤0 Alternative Hypothesis: Ha:μ1-μ2>0 Sample 1:…
Q: If you have a hypothesis test with alpha = 0.1, which of the following P-Values does NOT imply…
A:
Q: Test the null hypothesis H0:μ=3.9 against the alternative hypothesis HA:μ≠3.9, based on a random…
A: Given,sample size(n)=29sample mean(x¯)=4.1standard deviation(σ)=0.89H0:μ=3.9HA:μ≠3.9
Q: Find the value of the standard score, z, and determine whether to reject the null hypothesis at a…
A: Given that Null hypothesis H0 : μ=19.1 meters Alternative hypothesis H1 : μ≠19.1 meters Sample size…
Q: You are presented with the offspring of the yellow body, medium bristled X yellow body, medium…
A: Degree of freedom = (r-1) (c-1)
Q: The test statistic of z = 1.26 is obtained when testing the claim that p > 0.2. a. Identify the…
A: Given: Test statistic (z)= 1.26 Alternative hypothesis: Ha:p>0.2
Q: In a test of the null hypothesis HO: p= Based on these statistics, which of the following…
A: Solution: Given information: μ=10 Population mean x= 13.4 Sample mean
Q: Consider the two-sided hypothesis testing problem: Но : и — 10 H1 : µ # 10 Which of the shaded areas…
A: Given information: The two-tailed hypothesis is being tested. H0:μ=10H1:μ≠10 The critical values are…
Q: Are avid readers more likely to wear glasses than those who read less frequently? Three hundred men…
A:
Q: The test statistic of z 1.26 is obtained when testing the claim that p>0.2. a. Identify the…
A: a. The test statistic of z=1.26 and the claim of the test is p>0.2. The claim shows the symbol…
Q: Consider the following hypothesis test. H0: μ1 − μ2 = 0 Ha: μ1 − μ2 ≠ 0 The following results are…
A: The provided data is,
Q: Test the claim that the proportion of men who own cats is significantly different than 90% at the…
A:


Trending now
This is a popular solution!

Step by step
Solved in 2 steps with 1 images


- Birthweight In 2003 the Journal of the AmericanMedical Association reported a study examining thepossible impact of air pollution caused by the 9/11 attack New York’s World Trade Center on the weight ofbabies. Researchers found that 8% of 182 babies born tomothers who were exposed to heavy doses of soot andash on September 11 were classified as having low birthweight. Only 4% of 2300 babies born in another NewYork City hospital whose mothers had not been near thesite of the disaster were similarly classified. Does thisindicate a possibility that air pollution might be linked toa significantly higher proportion of low-weight babies?a) Was this an experiment? Explain. b) Test an appropriate hypothesis and state your conclu-sion in context. c) If you concluded there is a difference, estimate thatdifference with a confidence interval and interpret thatinterval in context.A statistical program is recommended. Jensen Tire & Auto is in the process of deciding whether to purchase a maintenance contract for its new computer wheel alignment and balancing machine. Managers feel that maintenance expense should be related to usage, and they collected the following information on weekly usage (hours) and annual maintenance expense (in hundreds of dollars). Weekly Usage(hours) AnnualMaintenanceExpense 13 17.0 10 22.0 20 30.0 28 37.0 32 47.0 17 30.5 24 32.5 31 39.0 40 51.5 38 40.0 #1) Develop the estimated regression equation that could be used to predict the annual maintenance expense (in hundreds of dollars) given the weekly usage (in hours). (Round your numerical values to two decimal places.) #2) The expected expense of a machine being used 34 hours per week is $ hundred.The Cambridge Study in Delinquent Development was under-taken in north London to investigate the links between criminal behavior in young men and the socioeconomic factors of their upbringing. A cohort of 395 boys was followed for about 20 years, starting at the age of 8 or 9. The following table shows the total number of criminal convictions by the boys between the start and end of the study. Number of convictions Frequency 0 265 1 49 2 21 3 19 4 10 5 10 6 2 7 2 8 4 9 2 10 1 11 4 12 3 13 1 14 2 a) How many variables are present in this table? b) Calculate the sample mean, sample standard deviation, median, the interquartile range of the number of convictions.
- Consider the following 2 × 2 table from a hypothetical cohort study. Calculate the relative risk of CVD comparing those with high fasting glucose (≥126 mg/dL) with those with normal fasting glucose (<126 mg/dL) Serum fasting glucose Developed CVD Did not develop CVD Total ≥126 mg/dL (exposed) 125 325 450 <126 mg/dL (not exposed) 50 500 550 Total 175 825 1000 Group of answer choices 0.33 0.75 1.02 3.08 5.34which of the following individuals is likely to be excluded from a clinical trial? a-individual with other diseases besides the disease of interest b-an individual whose data is considered to be an outlier c-an individual of who is considered to be a minority d-an individual who will have difficulty complying trial protocols.As part of a study on transportation safety, the U.S. Department of Transportation collected data on the number of fatal accidents per 1000 licenses and the percentage of licensed drivers under the age of 21 in a sample of 42 cities. Data collected over a one-year period follow. These data are contained in the file Safety. PercentUnder 21 Fatal Accidentsper 1000 13 2.962 12 0.708 8 0.885 12 1.652 11 2.091 17 2.627 18 3.83 8 0.368 13 1.142 8 0.645 9 1.028 16 2.801 12 1.405 9 1.433 10 0.039 9 0.338 11 1.849 12 2.246 14 2.855 14 2.352 11 1.294 17 4.1 8 2.19 16 3.623 15 2.623 9 0.835 8 0.82 14 2.89 8 1.267 15 3.224 10 1.014 10 0.493 14 1.443 18 3.614 10 1.926 14 1.643 16 2.943 12 1.913 15 2.814 13 2.634 9 0.926 17 3.256 d. Give a 95% interval estimate of the number of fatal accidents per 1000 licenses in a city where 15% of the licensed drivers are under 21.
- As part of a study on transportation safety, the U.S. Department of Transportation collected data on the number of fatal accidents per 1000 licenses and the percentage of licensed drivers under the age of 21 in a sample of 42 cities. Data collected over a one-year period follow. These data are contained in the file Safety. PercentUnder 21 Fatal Accidentsper 1000 13 2.962 12 0.708 8 0.885 12 1.652 11 2.091 17 2.627 18 3.83 8 0.368 13 1.142 8 0.645 9 1.028 16 2.801 12 1.405 9 1.433 10 0.039 9 0.338 11 1.849 12 2.246 14 2.855 14 2.352 11 1.294 17 4.1 8 2.19 16 3.623 15 2.623 9 0.835 8 0.82 14 2.89 8 1.267 15 3.224 10 1.014 10 0.493 14 1.443 18 3.614 10 1.926 14 1.643 16 2.943 12 1.913 15 2.814 13 2.634 9 0.926 17 3.256 a. What is the value of the standard error of the estimate? b. Test for a significant relationship (show all appropriate steps). Use α = .05. c. Give a 95% interval estimate of the…A sociologist wants to investigate the question, "Is there a relationship between texting during class and grade-point-average (GPA) among high school seniors in a large district?" Which study design is most appropriate? Before the semester starts, randomly select 40 seniors from each high school who do not text during class. Assign 20 to the texting treatment group (text three or more times during every class meeting) and 20 to the control group (no texting during class). At the end of the semester, obtain each student’s GPA from the appropriate admissions and records office. Compare the GPA of students who routinely text during class to the GPA of students who do not text during class. Before the semester starts, randomly select 40 seniors from each high school who do not text during class. Assign 20 to the texting treatment group (text three or more times during every class meeting) and 20 to the control group (no texting during class). At the end of the semester,…A suburban hotel derives its revenue from its hotel and restaurant operations. Theowners are interested in the relationship between the number of rooms occupied on anightly basis and the revenue per day in the restaurant. Below is a sample of 25 days(Monday through Thursday) from last year showing the restaurant income and numberof rooms occupied.
- Calculate and compare central tendency and variability of case rate per 100,000 and GDP per capita in Q2 of 2020 among swing, solid blue, and solid red states Political affiliation: Swing States State Case Rate per 100,000 GDP Per Capita in Q2 2020 ($) Arizona 5,079 48,105 Florida 4,886 47,802 Georgia 4,766 54,696 Michigan 4,271 47,612 Nevada 5,541 50,783 North Carolina 3,804 52,133 Pennsylvania 3,280 56,540 Wisconsin 7,587 53,934 Political affiliation: Solid Red States State Case Rate per 100,000 GDP Per Capita in Q2 2020 ($) Arkansas 5,671 40,033 Indiana 5,703 51,102 Kansas 5,780 55,423 Nebraska 7,248 61,875 Kentucky 4,490 43,396 Oklahoma 5,224 43,736 Tennessee 5,917 48,790 Wyoming 6,286 57,421 Political affiliation: Solid Blue States State Case Rate per 100,000 GDP Per Capita in Q2 2020 ($) California 3,392 73,219 Colorado 4,575 63,384 Connecticut 3,575 73,685 Maryland 3,596 65,933 Massachusetts 3,730 79,296 New Jersey…High levels of blood sugar are associated with an increased risk of type 2 diabetes. A levelhigher than normal is referred to as “impaired fasting glucose.” The article “Association ofLow-Moderate Arsenic Exposure and Arsenic Metabolism with Incident Diabetes andInsulin Resistance in the Strong Heart Family Study” (M. Grau-Perez, C. Kuo, et al.,Environmental Health Perspectives, 2017, online) reports a study in which 47 of 155 peoplewith impaired fasting glucose had type 2 diabetes. Consider this to be a simple randomsample. a) Find a 95% confidence interval for the proportion of people with impaired fasting glucose who have type 2 diabetes. b) Find a 99% confidence interval for the proportion of people with impaired fasting glucose who have type 2 diabetes. c) A doctor claims that less than 35% of people with impaired fasting glucose have type 2 diabetes. With what level of confidence can this claim be made?In a Denver community, 50 cases of diabetes were reported among 15-19 years old out of a total population of 46,000 between September 1 to December 31, 2016. Ten percent (4,600) of the population were between 15-19 years old on April 1, 2016 and the size and age distribution of the population has remained constant. An investigation of the cases in the 15-19-year age group revealed that 22 of the reported cases were contracted prior to September 1. In addition, another 18 cases developed in April and May but were clinically resolved before September 1. What was the cumulative incidence rate of disease in 15-19 year olds per 1,000 population in this Denver community during the period September 1 to December 31, 2016?