". Sociology: Family, Size The following data are, based on information taken frou the Statistical Abstract of the United States (112th Edition). In this table, x = siz of family., The percentage data are the percentages of U.S, farpilies pf this nize. 7'or more 5. 10% 2. 3. 4. :42% 21% %3* (a) Convert the percentage data to probabilities and máke a, histogram of the prob ability distribution for family size. (b) What is the probahility that a family selected at random will have only twe members? (c) What is the probability: that a' family selected at random will have more that three members?. (d) Compute , the expected family sizė (round families of size 7 or more to size (e) Compute o, the standard deviation (round families of size 7 ór more to size
". Sociology: Family, Size The following data are, based on information taken frou the Statistical Abstract of the United States (112th Edition). In this table, x = siz of family., The percentage data are the percentages of U.S, farpilies pf this nize. 7'or more 5. 10% 2. 3. 4. :42% 21% %3* (a) Convert the percentage data to probabilities and máke a, histogram of the prob ability distribution for family size. (b) What is the probahility that a family selected at random will have only twe members? (c) What is the probability: that a' family selected at random will have more that three members?. (d) Compute , the expected family sizė (round families of size 7 or more to size (e) Compute o, the standard deviation (round families of size 7 ór more to size

College Algebra
7th Edition
ISBN:9781305115545
Author:James Stewart, Lothar Redlin, Saleem Watson
Publisher:James Stewart, Lothar Redlin, Saleem Watson
Chapter9: Counting And Probability
Section9.3: Binomial Probability
Problem 33E: Sick leave probability that a given worker at Dyno Nutrition Will call in sick on a Monday is 004....

Related questions
Question
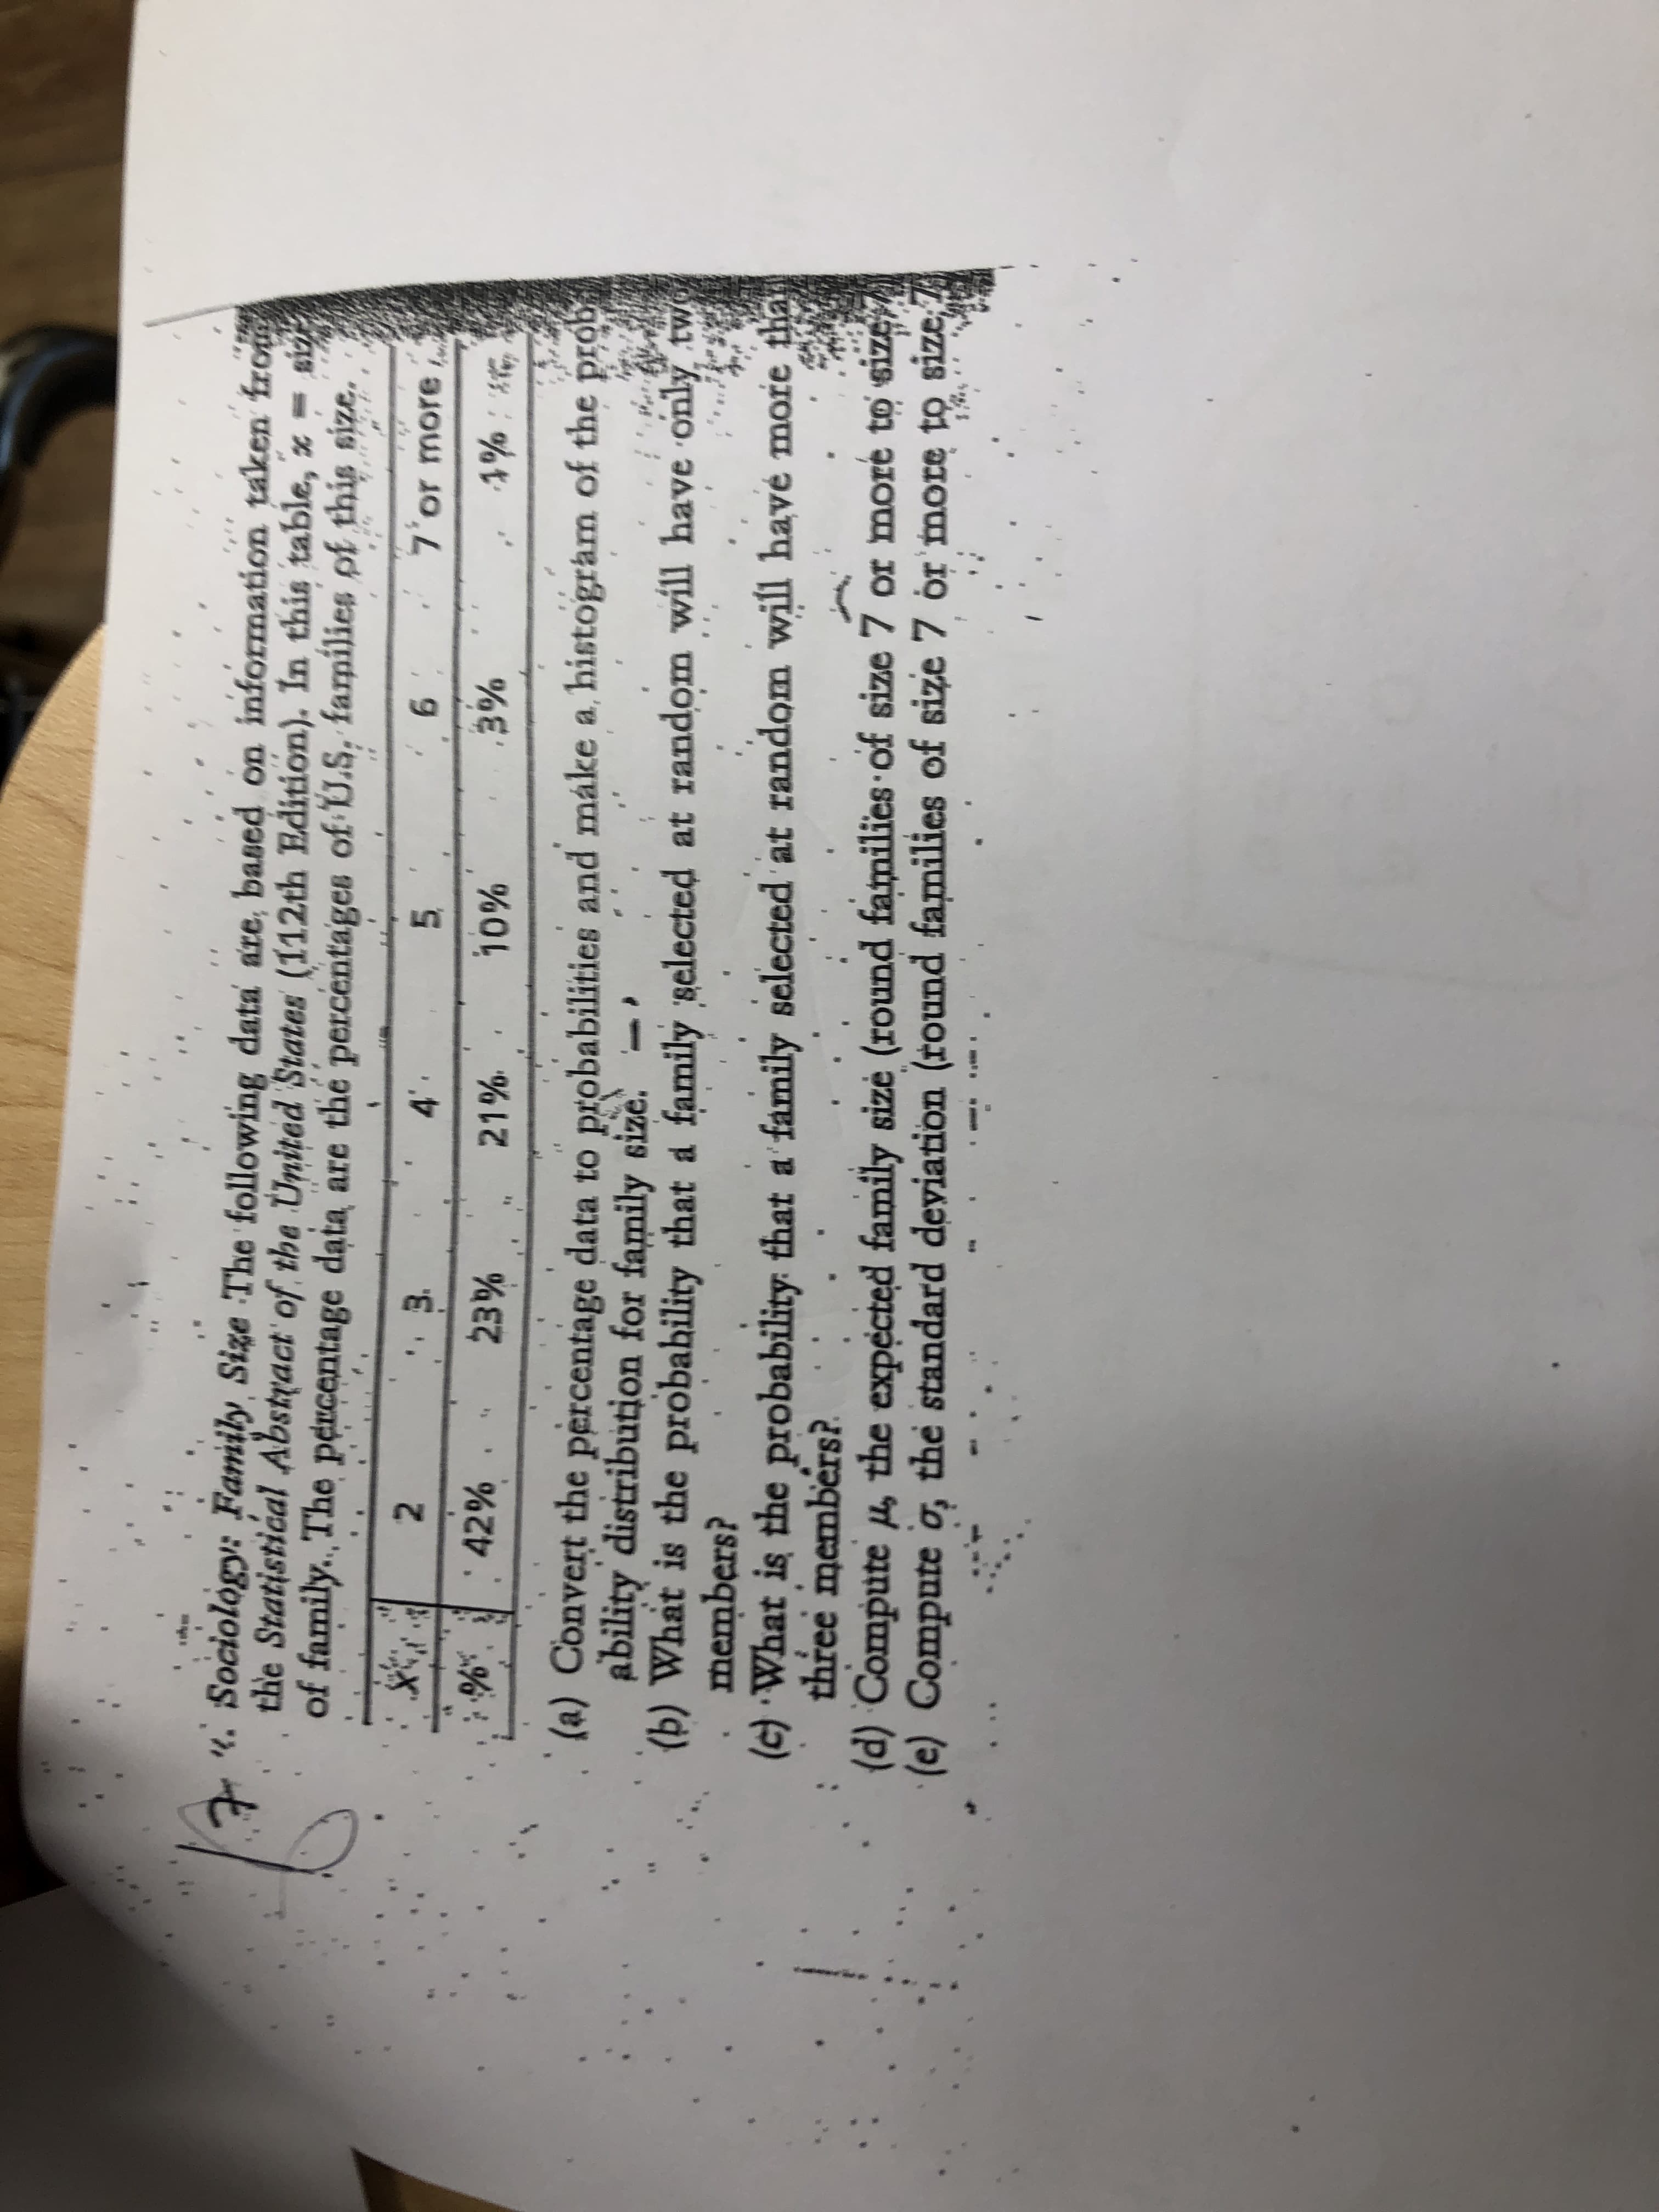
Transcribed Image Text:". Sociology: Family, Size The following data are, based on information taken frou
the Statistical Abstract of the United States (112th Edition). In this table, x = siz
of family., The percentage data are the percentages of U.S, farpilies pf this nize.
7'or more
5.
10%
2.
3.
4.
:42%
21%
%3*
(a) Convert the percentage data to probabilities and máke a, histogram of the prob
ability distribution for family size.
(b) What is the probahility that a family selected at random will have only twe
members?
(c) What is the probability: that a' family selected at random will have more that
three members?.
(d) Compute , the expected family sizė (round families of size 7 or more to size
(e) Compute o, the standard deviation (round families of size 7 ór more to size
Expert Solution
This question has been solved!
Explore an expertly crafted, step-by-step solution for a thorough understanding of key concepts.

This is a popular solution!

Trending now
This is a popular solution!

Step by step
Solved in 4 steps with 3 images

Recommended textbooks for you
College Algebra
Algebra
ISBN:
9781305115545
Author:
James Stewart, Lothar Redlin, Saleem Watson
Publisher:
Cengage Learning


College Algebra
Algebra
ISBN:
9781305115545
Author:
James Stewart, Lothar Redlin, Saleem Watson
Publisher:
Cengage Learning