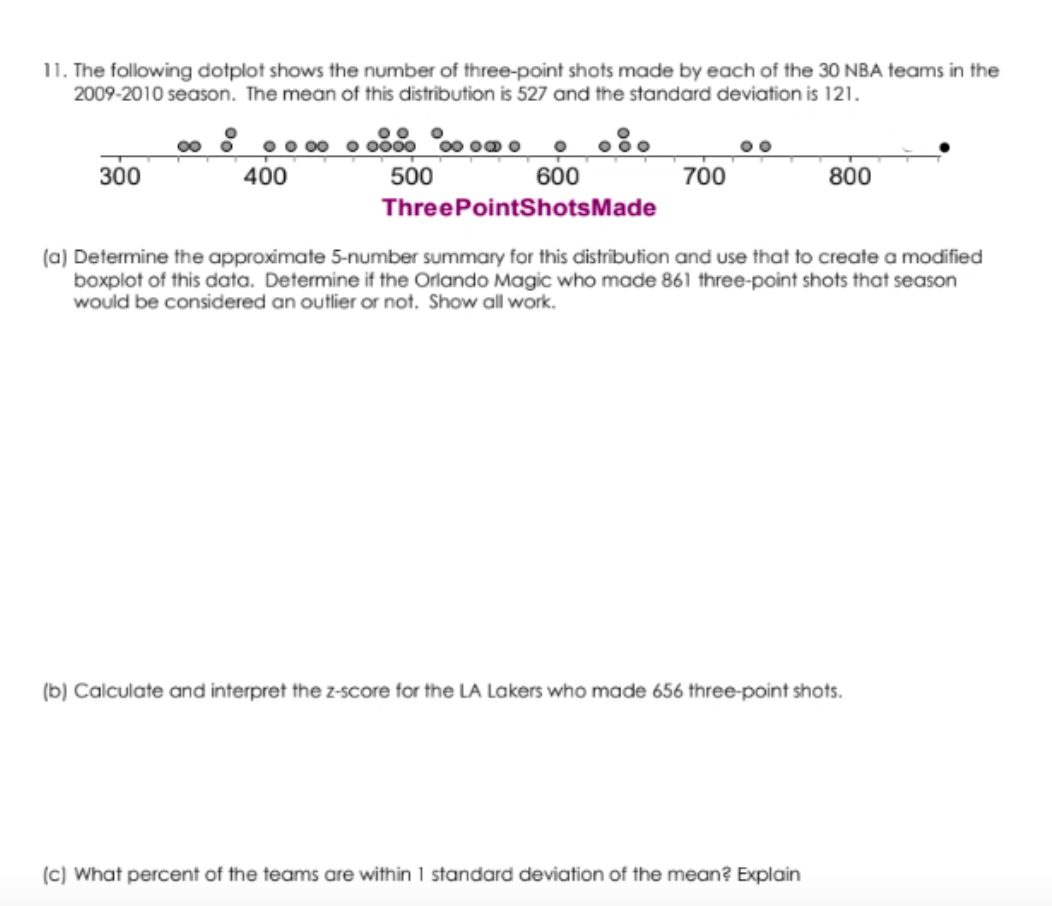
. The following dotplot shows the number of three-point shots made by each of the 30 NBA teams in the 2009-2010 season. The mean of this distribution is 527 and the standard deviation is 121.
. The following dotplot shows the number of three-point shots made by each of the 30 NBA teams in the 2009-2010 season. The mean of this distribution is 527 and the standard deviation is 121.

Glencoe Algebra 1, Student Edition, 9780079039897, 0079039898, 2018
18th Edition
ISBN:9780079039897
Author:Carter
Publisher:Carter
Chapter10: Statistics
Section10.4: Distributions Of Data
Problem 19PFA

Related questions

Question
Transcribed Image Text:11. The following dotplot shows the number of three-point shots made by each of the 30 NBA teams in the
2009-2010 season. The mean of this distribution is 527 and the standard deviation is 121.
300
0 o 00
400
0000 00 0@
500
600
800
700
ThreePointShotsMade
(a) Determine the approximate 5-number summary for this distribution and use that to create a modified
boxplot of this data. Determine if the Orlando Magic who made 861 three-point shots that season
would be considered an outlier or not. Show all work.
(b) Calculate and interpret the z-score for the LA Lakers who made 656 three-point shots.
(c) What percent of the teams are within 1 standard deviation of the mean? Explain
Expert Solution
Step 1
Given information:
The data represents the values of the number of 3-point shots made by each of the 30 NBA teams in 2009-2010 season.
The mean of the distribution is µ = 527.
The standard deviation of the distribution is σ = 121.

Trending now
This is a popular solution!

Step by step
Solved in 5 steps with 5 images

Knowledge Booster


Learn more about
Need a deep-dive on the concept behind this application? Look no further. Learn more about this topic, statistics and related others by exploring similar questions and additional content below.Recommended textbooks for you
Glencoe Algebra 1, Student Edition, 9780079039897…
Algebra
ISBN:
9780079039897
Author:
Carter
Publisher:
McGraw Hill
Glencoe Algebra 1, Student Edition, 9780079039897…
Algebra
ISBN:
9780079039897
Author:
Carter
Publisher:
McGraw Hill