.... . ... . A report stated that 28% of the people in a representative sample of adult Americans ages 33 to 49 rated a landline telephone among the three most important services that they purchase for their home. In a representative sample of adult Americans ages 50 to 68, 42% rated a landline telephone as one of the top three services they purchase for their home. Suppose that the samples were independently selected and that the sample size was 600 for the 33 to 49 age group sample and 650 for the 50 to 68 age group sample. Does this data provide convincing evidence that the proportion of adult Americans ages 33 to 49 who rate a landline phone in the top three is less than this proportion for adult Americans ages 50 to 68? Test the relevant hypotheses using a = 0.05. (Use p33 to 49 age group- P50 to 68 age group .. .. ... n USE SALT Find the test statistic. (Round your answer to two decimal places.) Find the P-value. (Round your answer to four decimal places.) P-value = State your conclusion. O Reject H. We do not have convincing evidence that the proportion of adult Americans ages 33 to 49 who rate a landline phone in the top three services they purchase for their home is less than this proportion for adult Americans ages 50 to 68. O Fail to reject H. We have convincing evidence that the proportion of adult Americans ages 33 to 49 who rate a landline phone in the top three services they purchase for their home is less than this proportion for adult Americans ages 50 to 68. O Reject Ho. We have convincing evidence that the proportion of adult Americans ages 33 to 49 who rate a landline phone in the top three services they purchase for their home is less than this proportion for adult Americans ages 50 to 68. O Fail to reject Ho. We do not have convincing evidence that the proportion of adult Americans ages 33 to 49 who rate a landline phone in the top three services they purchase for their home is less than this proportion for adult Americans ages 50 to 68.
.... . ... . A report stated that 28% of the people in a representative sample of adult Americans ages 33 to 49 rated a landline telephone among the three most important services that they purchase for their home. In a representative sample of adult Americans ages 50 to 68, 42% rated a landline telephone as one of the top three services they purchase for their home. Suppose that the samples were independently selected and that the sample size was 600 for the 33 to 49 age group sample and 650 for the 50 to 68 age group sample. Does this data provide convincing evidence that the proportion of adult Americans ages 33 to 49 who rate a landline phone in the top three is less than this proportion for adult Americans ages 50 to 68? Test the relevant hypotheses using a = 0.05. (Use p33 to 49 age group- P50 to 68 age group .. .. ... n USE SALT Find the test statistic. (Round your answer to two decimal places.) Find the P-value. (Round your answer to four decimal places.) P-value = State your conclusion. O Reject H. We do not have convincing evidence that the proportion of adult Americans ages 33 to 49 who rate a landline phone in the top three services they purchase for their home is less than this proportion for adult Americans ages 50 to 68. O Fail to reject H. We have convincing evidence that the proportion of adult Americans ages 33 to 49 who rate a landline phone in the top three services they purchase for their home is less than this proportion for adult Americans ages 50 to 68. O Reject Ho. We have convincing evidence that the proportion of adult Americans ages 33 to 49 who rate a landline phone in the top three services they purchase for their home is less than this proportion for adult Americans ages 50 to 68. O Fail to reject Ho. We do not have convincing evidence that the proportion of adult Americans ages 33 to 49 who rate a landline phone in the top three services they purchase for their home is less than this proportion for adult Americans ages 50 to 68.

Holt Mcdougal Larson Pre-algebra: Student Edition 2012
1st Edition
ISBN:9780547587776
Author:HOLT MCDOUGAL
Publisher:HOLT MCDOUGAL
Chapter11: Data Analysis And Probability
Section: Chapter Questions
Problem 8CR

Related questions
Question
10
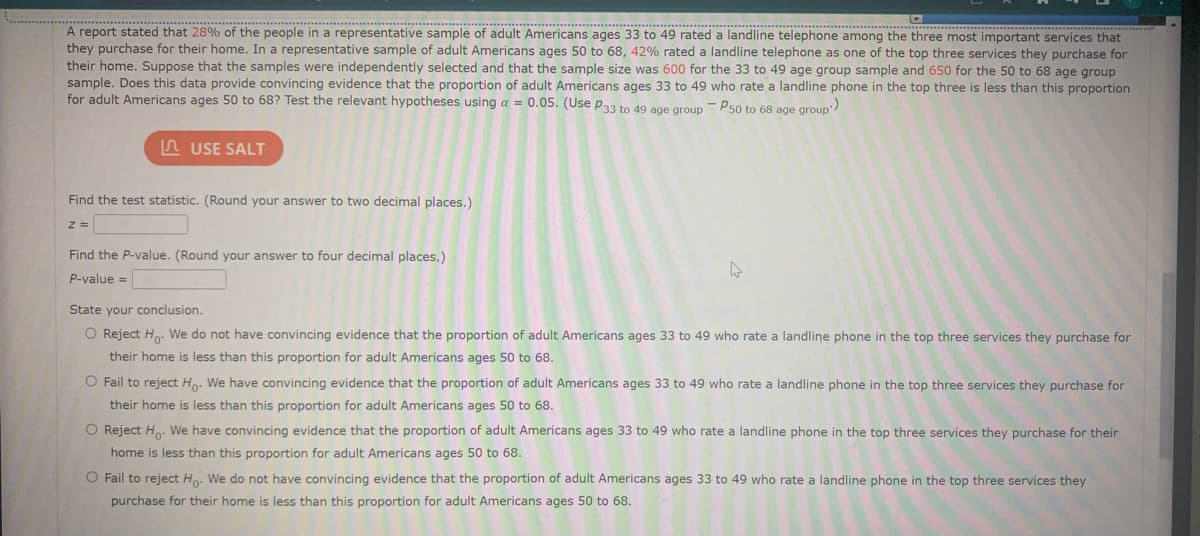
Transcribed Image Text:A report stated that 28% of the people in a representative sample of adult Americans ages 33 to 49 rated a landline telephone among the three most important services that
they purchase for their home. In a representative sample of adult Americans ages 50 to 68, 42% rated a landline telephone as one of the top three services they purchase for
their home. Suppose that the samples were independently selected and that the sample size was 600 for the 33 to 49 age group sample and 650 for the 50 to 68 age group
sample. Does this data provide convincing evidence that the proportion of adult Americans ages 33 to 49 who rate a landline phone in the top three is less than this proportion
for adult Americans ages 50 to 68? Test the relevant hypotheses using a = 0.05. (Use p33 to 49 age group - P50 to 68 age group
n USE SALT
Find the test statistic. (Round your answer to two decimal places.)
Find the P-value. (Round your answer to four decimal places.)
P-value =
State your conclusion.
O Reject Ho. We do not have convincing evidence that the proportion of adult Americans ages 33 to 49 who rate a landline phone in the top three services they purchase for
their home is less than this proportion for adult Americans ages 50 to 68.
O Fail to reject Ho. We have convincing evidence that the proportion of adult Americans ages 33 to 49 who rate a landline phone in the top three services they purchase for
their home is less than this proportion for adult Americans ages 50 to 68.
O Reject Ho. We have convincing evidence that the proportion of adult Americans ages 33 to 49 who rate a landline phone in the top three services they purchase for their
home is less than this proportion for adult Americans ages 50 to 68.
O Fail to reject Ho. We do not have convincing evidence that the proportion of adult Americans ages 33 to 49 who rate a landline phone in the top three services they
purchase for their home is less than this proportion for adult Americans ages 50 to 68.
Expert Solution
This question has been solved!
Explore an expertly crafted, step-by-step solution for a thorough understanding of key concepts.

This is a popular solution!

Trending now
This is a popular solution!

Step by step
Solved in 2 steps with 2 images

Recommended textbooks for you
Holt Mcdougal Larson Pre-algebra: Student Edition…
Algebra
ISBN:
9780547587776
Author:
HOLT MCDOUGAL
Publisher:
HOLT MCDOUGAL
Holt Mcdougal Larson Pre-algebra: Student Edition…
Algebra
ISBN:
9780547587776
Author:
HOLT MCDOUGAL
Publisher:
HOLT MCDOUGAL