..... (a) Construct a discrete probability distribution for the random variable x. x (# of children) P(x) 1 2 3 4 (Round to three decimal places as needed.)
..... (a) Construct a discrete probability distribution for the random variable x. x (# of children) P(x) 1 2 3 4 (Round to three decimal places as needed.)

Chapter8: Sequences, Series,and Probability
Section8.7: Probability
Problem 35E: Unemployment In 2015, there were approximately 8.3 million unemployed workers in the United States....

Related questions
Question
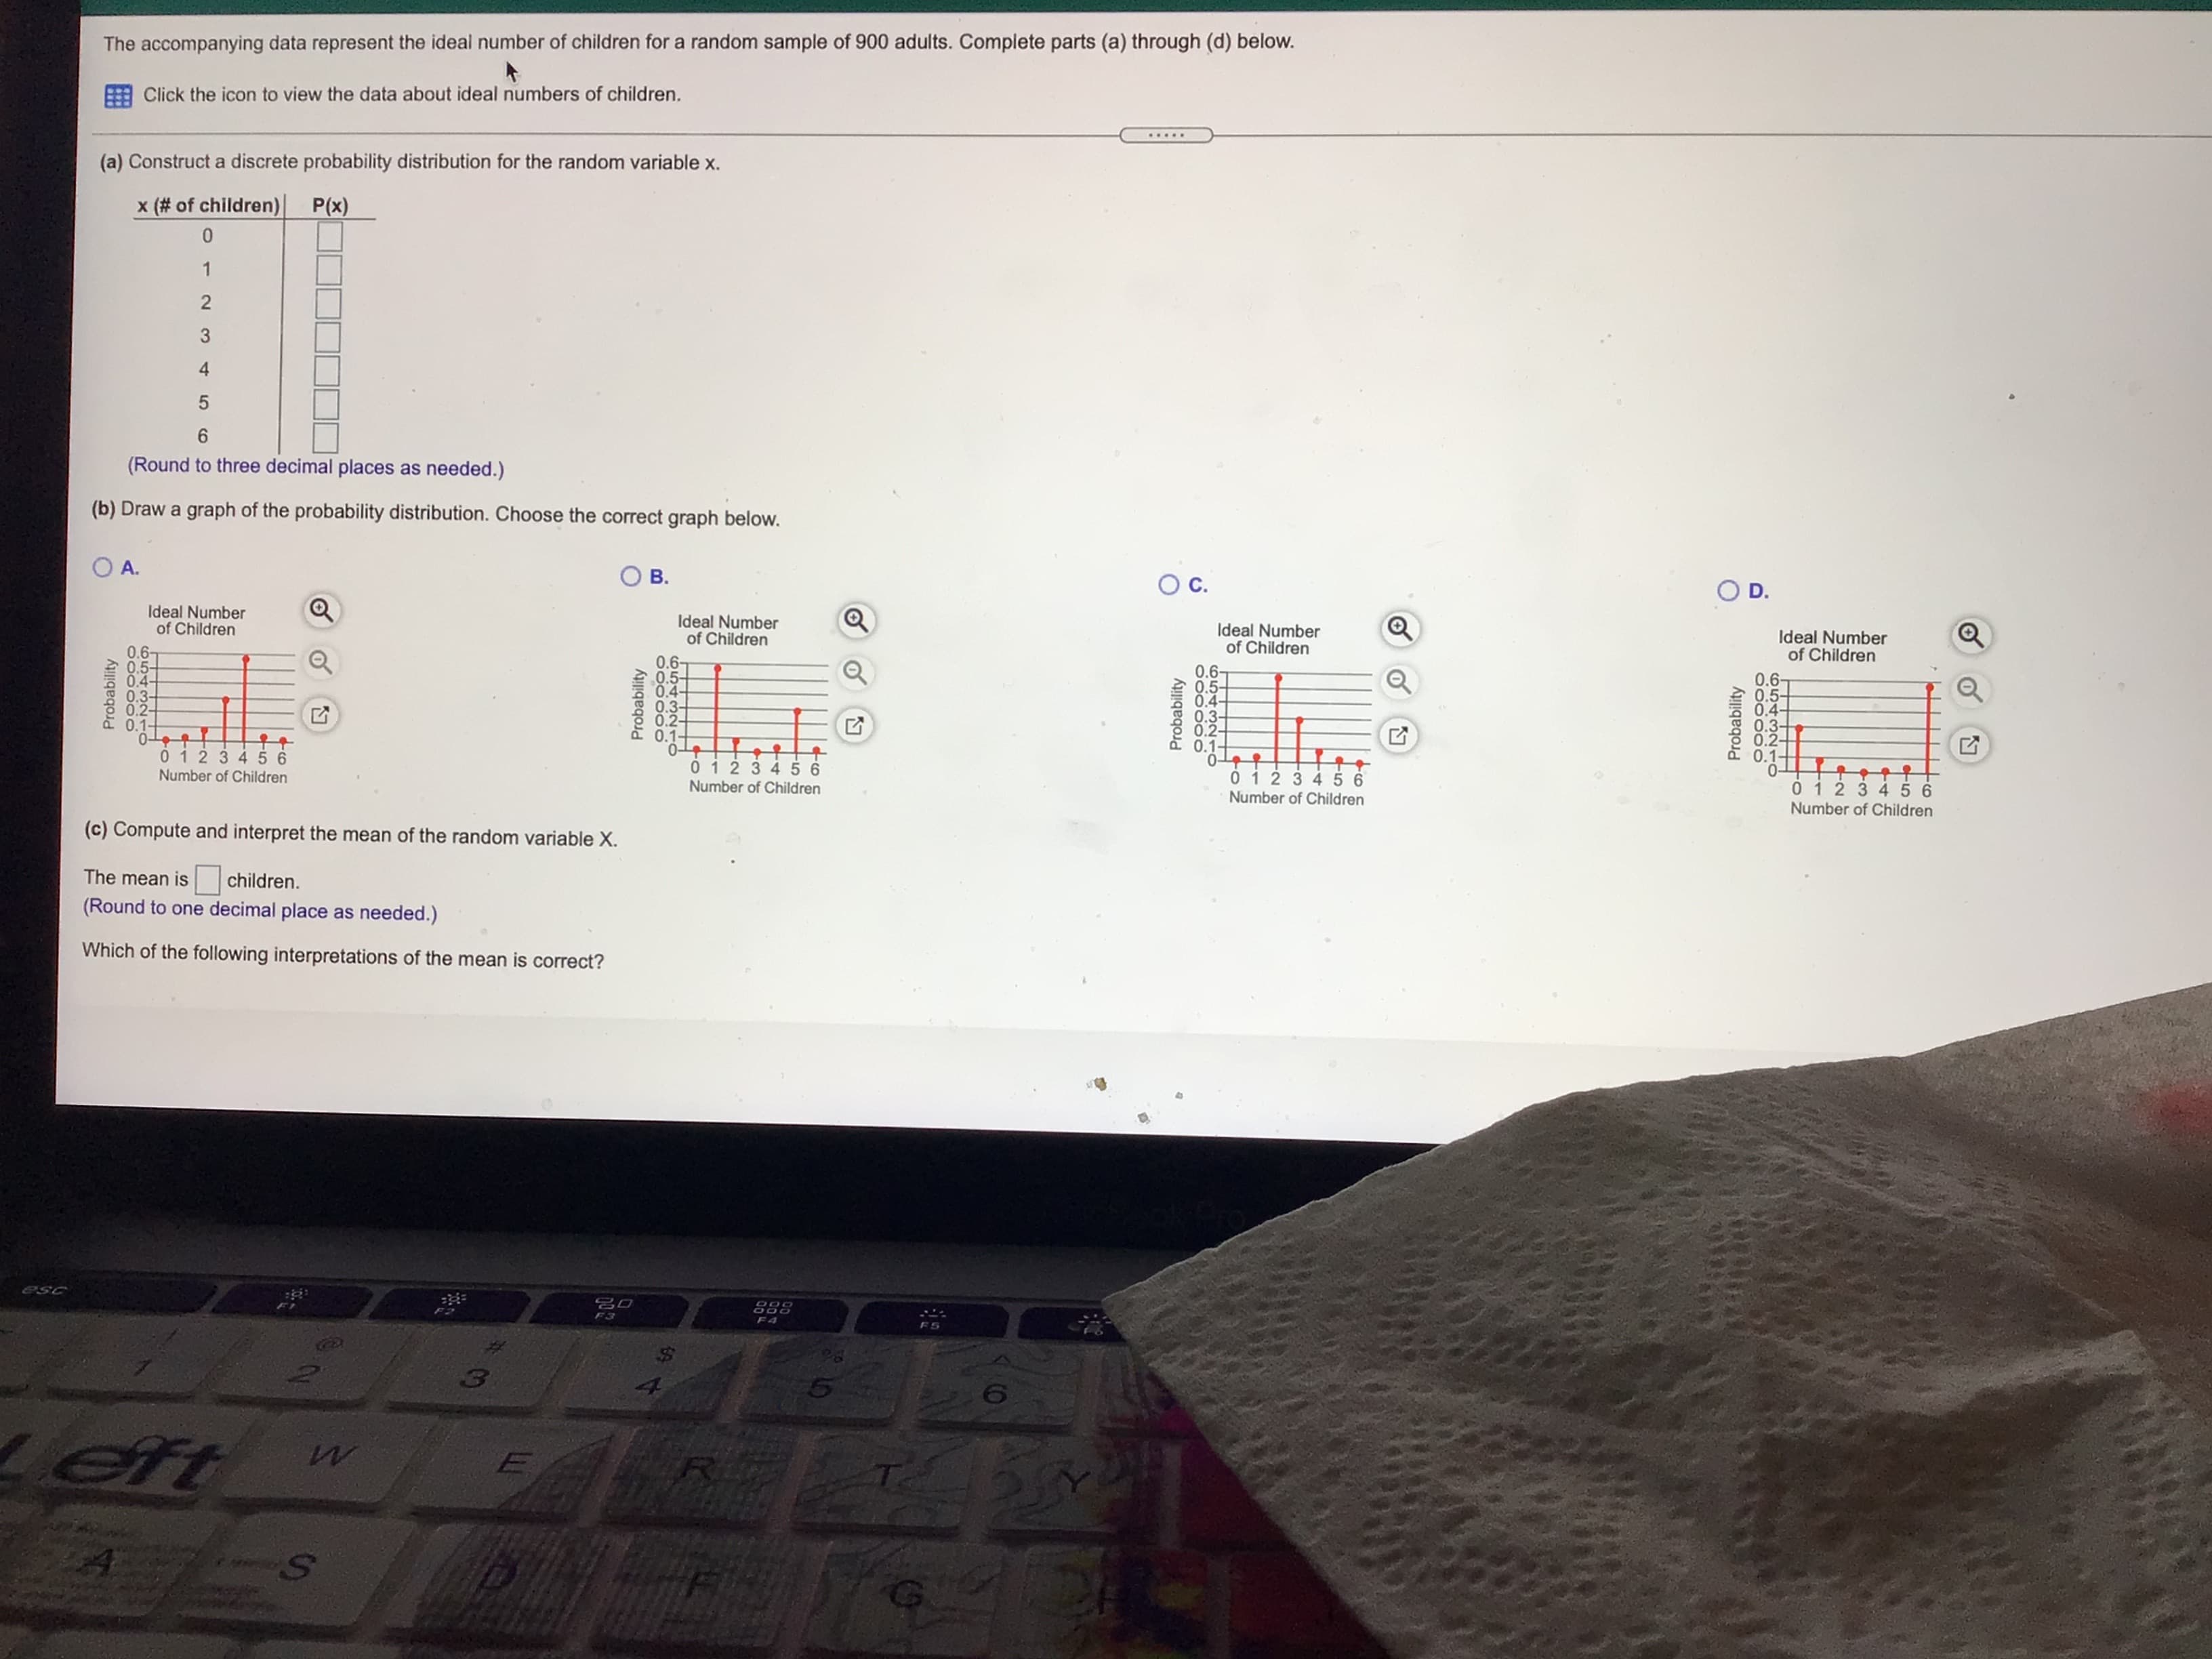
Transcribed Image Text:The accompanying data represent the ideal number of children for a random sample of 900 adults. Complete parts (a) through (d) below.
E Click the icon to view the data about ideal numbers of children.
.....
(a) Construct a discrete probability distribution for the random variable x.
x (# of children)
(x)d
1.
3
4.
5.
(Round to three decimal places as needed.)
(b) Draw a graph of the probability distribution. Choose the correct graph below.
O A.
Ideal Number
of Children
O D.
Ideal Number
of Children
Ideal Number
of Children
Ideal Number
of Children
0.6-
0.5+
0.4-
0.6-
0.5구
0.6-
0.5-
0.4-
0.6-
0.5-
0.4-
0.3-
0.2-
0.1-
0.3-
0.2-
0.3-
0.2-
0.1-
.4-
20.3-
0.2-
0.1-
C 0.1-
01234 56
Number of Children
0-
01234 56
0-
01234 56
0123456
Number of Children
Number of Children
Number of Children
(c) Compute and interpret the mean of the random variable X.
The mean is
children.
(Round to one decimal place as needed.)
Which of the following interpretations of the mean is correct?
F3
eft
TI
Probability
Probability
Probability
Probability
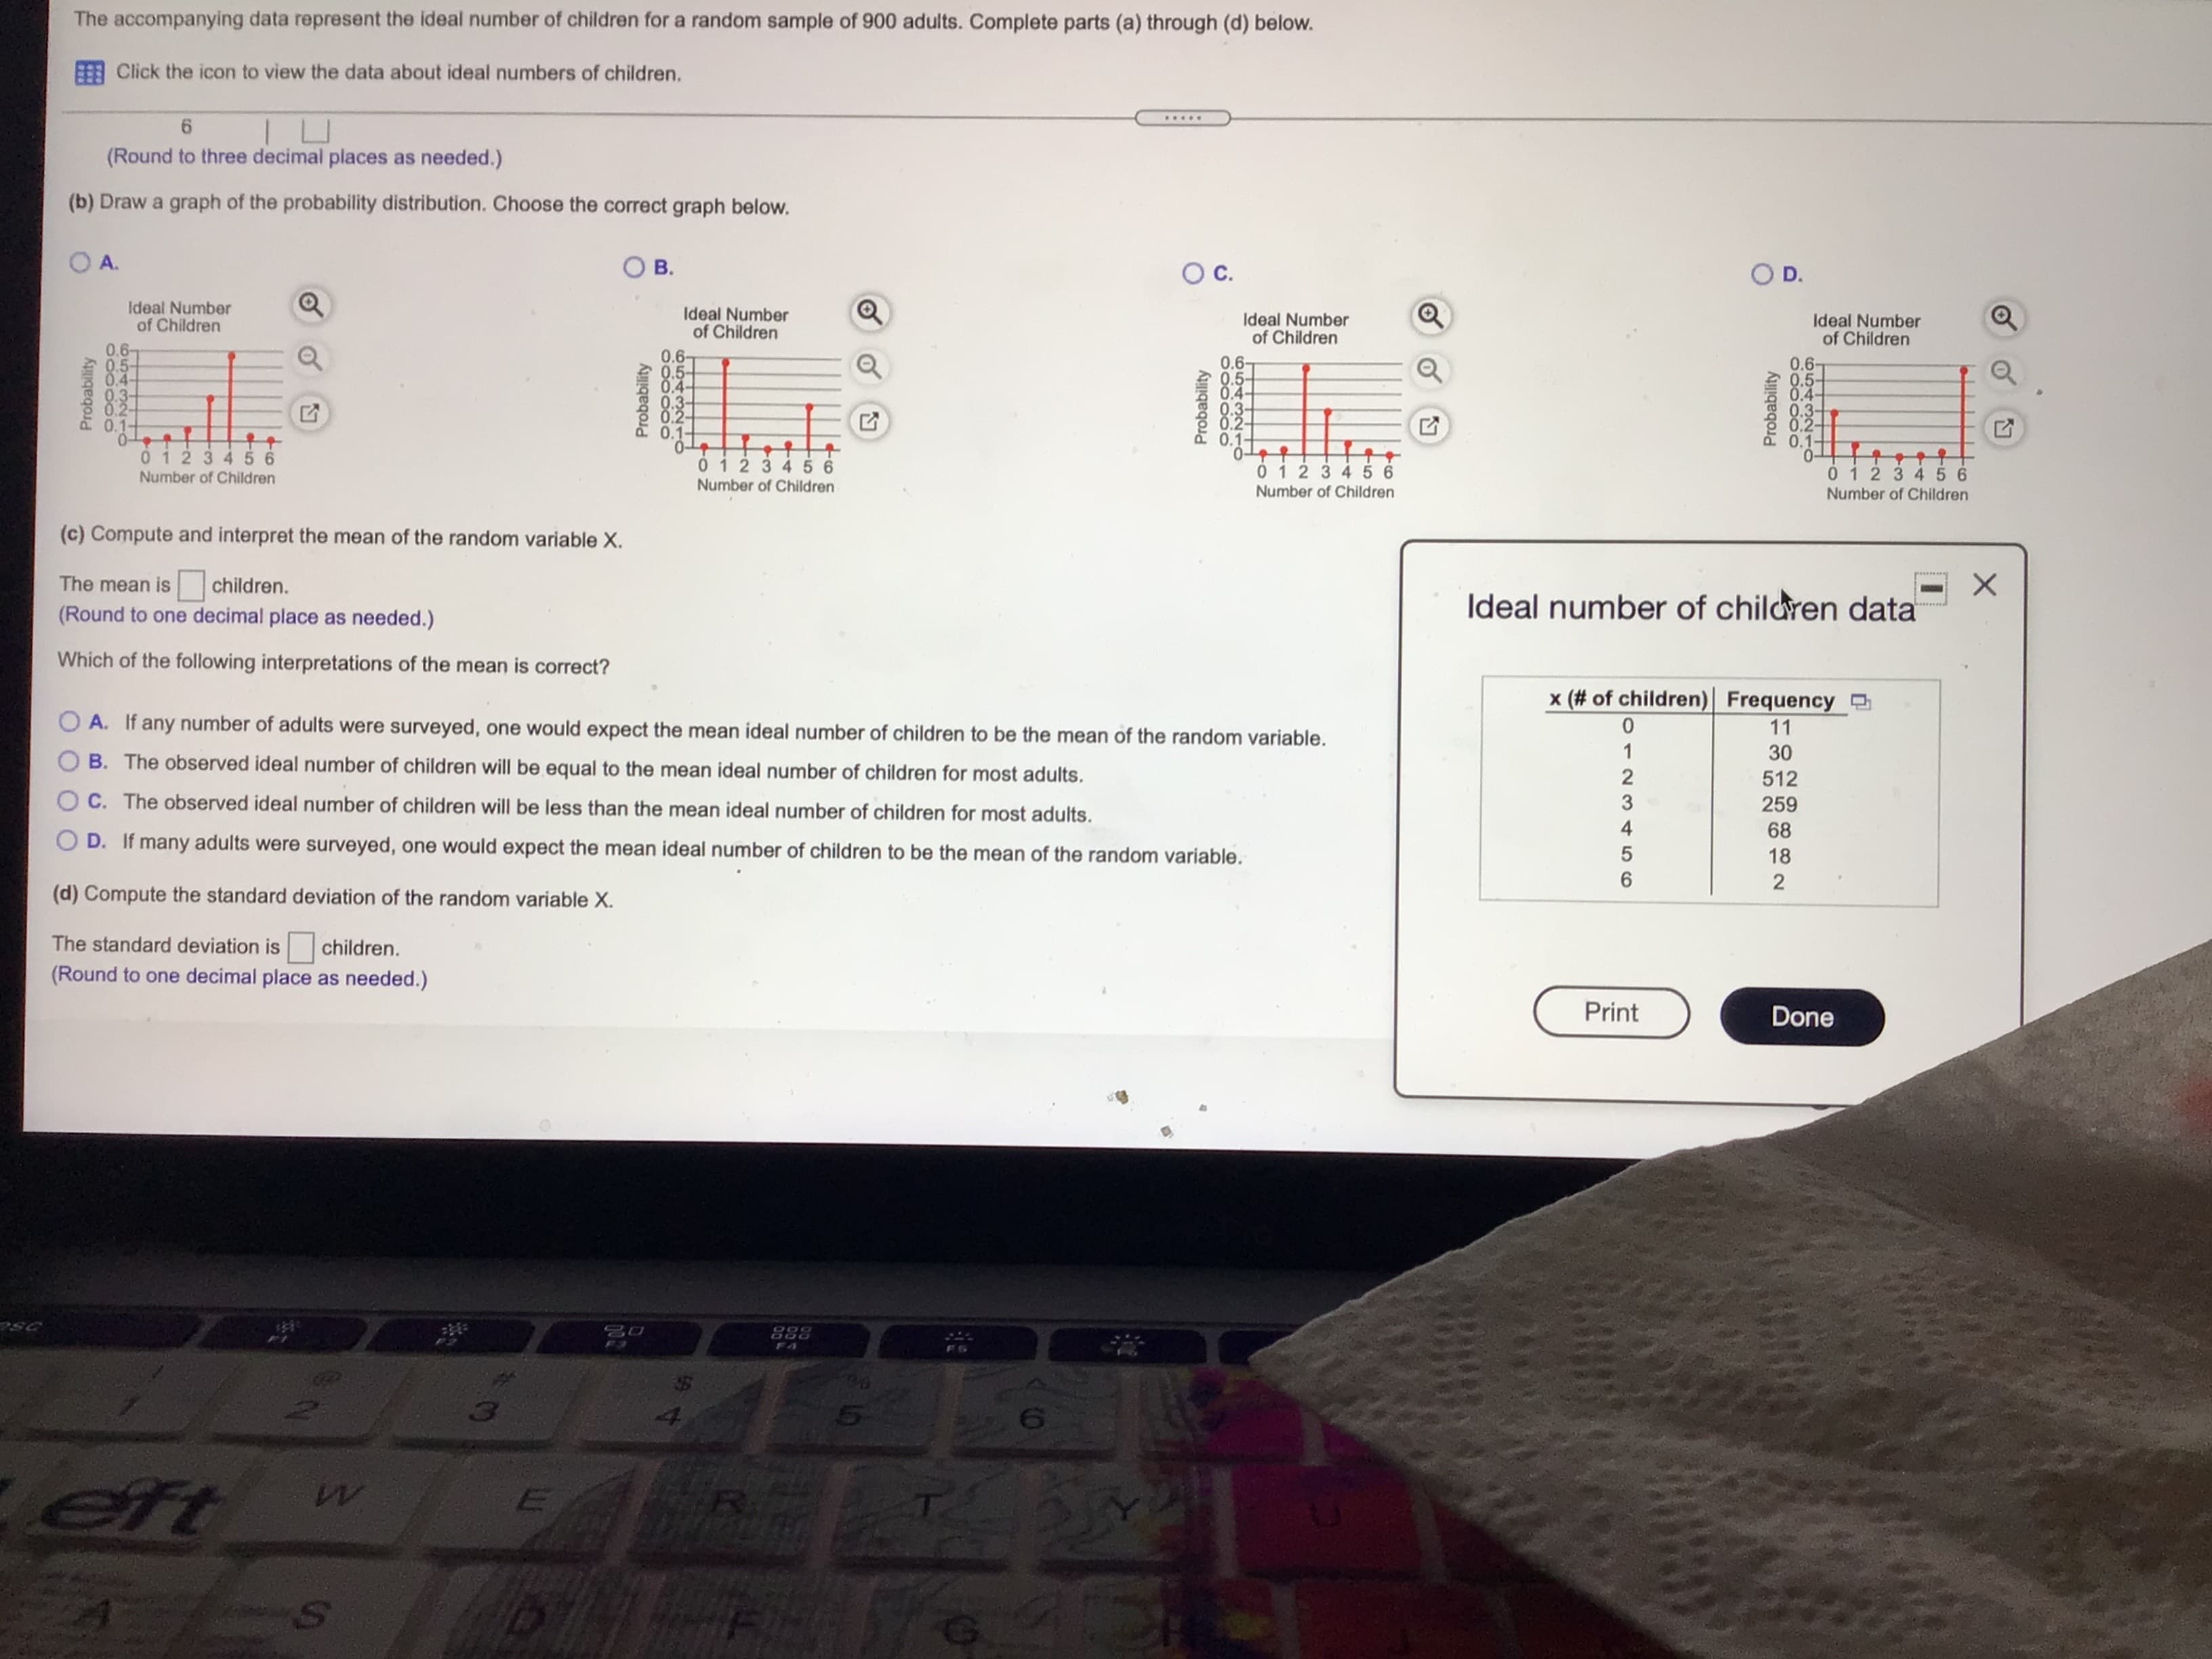
Transcribed Image Text:The accompanying data represent the ideal number of children for a random sample of 900 adults. Complete parts (a) through (d) below.
Click the icon to view the data about ideal numbers of children.
.....
(Round to three decimal places as needed.)
(b) Draw a graph of the probability distribution. Choose the correct graph below.
O A.
OD.
Ideal Number
of Children
Ideal Number
of Children
0.6
0.5-
0.4
Ideal Number
of Children
Ideal Number
of Children
0.6-
0.5-
0.4-
0.3-
0.2-
0.1-
0.6-
0.5-
0.6-
0.5-
0.4-
0.3-
0.2-
0.1-
.3-
0.2
.4-
0.3-
0.2-
0.1-
0.1-
0123456
0123456
0123456
Number of Children
Number of Children
Number of Children
Number of Children
01234 56
(c) Compute and interpret the mean of the random variable X.
The mean is
children.
(Round to one decimal place as needed.)
Ideal number of children data
Which of the following interpretations of the mean is correct?
x (# of children)| Frequency
11
O A. If any number of adults were surveyed, one would expect the mean ideal number of children to be the mean of the random variable.
B. The observed ideal number of children will be equal to the mean ideal number of children for most adults.
512
O C. The observed ideal number of children will be less than the mean ideal number of children for most adults.
259
68
18
O D. If many adults were surveyed, one would expect the mean ideal number of children to be the mean of the random variable.
(d) Compute the standard deviation of the random variable X.
9.
The standard deviation is
children.
(Round to one decimal place as needed.)
Print
Done
USC
Probability
Probability
Probability
3210
1234t56
Probability
4000500
65432 10
Expert Solution
This question has been solved!
Explore an expertly crafted, step-by-step solution for a thorough understanding of key concepts.

This is a popular solution!

Trending now
This is a popular solution!

Step by step
Solved in 4 steps with 3 images

Recommended textbooks for you