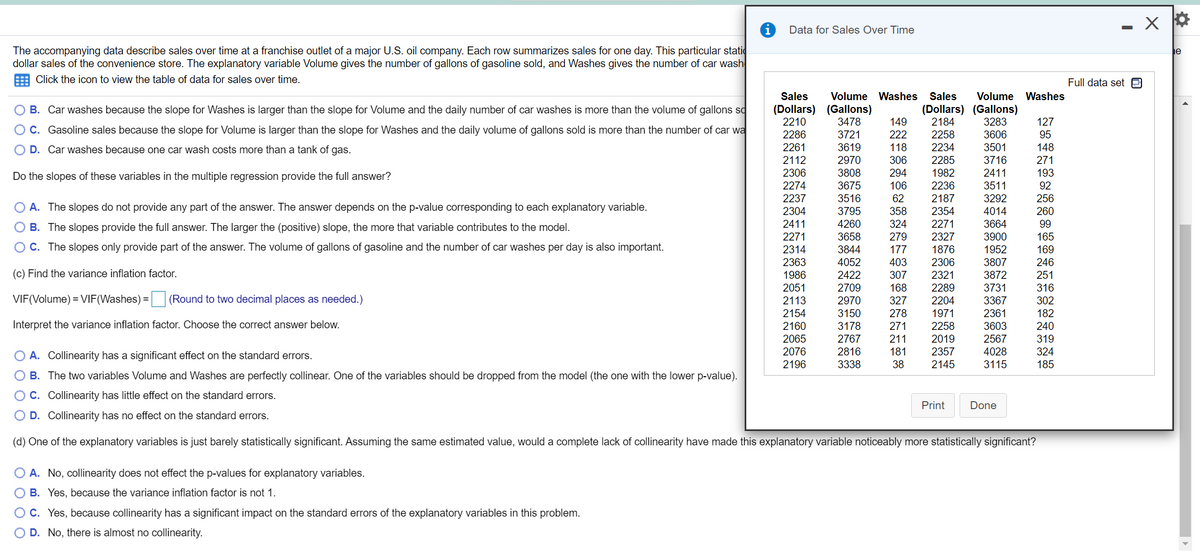
0 Data for Sales Over Time The accompanying data describe sales over time at a franchise outlet of a major U.S. oil company. Each row summarizes sales for one day. This particular stati dollar sales of the convenience store. The explanatory variable Volume gives the number of gallons of gasoline sold, and Washes gives the number of car wash E Click the icon to view the table of data for sales over time. Full data set e Sales Volume Washes Sales Volume Washes B. Car washes because the slope for Washes is larger than the slope for Volume and the daily number of car washes is more than the volume of gallons se c. Gasoline sales because the slope for Volume is larger than the slope for Washes and the daily volume of gallons sold is more than the number of car wa D. Car washes because one car wash costs more than a tank of gas. (Dollars) (Gallons) 3478 3721 3619 2970 3808 3675 3516 3795 (Dollars) (Gallons) 2184 3283 2258 3606 3501 2234 127 95 148 2210 2286 149 222 118 2261 2112 2306 2274 2237 2304 2411 2271 2314 2363 1986 2051 2113 2154 306 294 106 62 2285 1982 2236 2187 2354 2271 2327 1876 2306 2321 2289 2204 1971 2258 2019 2357 2145 3716 2411 3511 3292 271 193 92 256 Do the slopes of these variables in the multiple regression provide the full answer? O A. The slopes do not provide any part of the answer. The answer depends on the p-value corresponding to each explanatory variable. 358 324 279 4014 260 4260 3658 3844 3664 99 OB. The slopes provide the full answer. The larger the (positive) slope, the more that variable contributes to the model. OC. The slopes only provide part of the answer. The volume of gallons of gasoline and the number of car washes per day is also important. 165 169 246 251 316 302 182 3900 177 1952 3807 3872 3731 3367 4052 403 307 168 327 (c) Find the variance inflation factor. 2422 2709 2970 3150 3178 2767 2816 3338 VIF(Volume) = VIF(Washes) = (Round to two decimal places as needed.) 278 2361 Interpret the variance inflation factor. Choose the correct answer below. 2160 2065 2076 2196 271 211 181 3603 2567 4028 3115 240 319 324 185 O A. Collinearity has a significant effect on the standard errors. 38 OB. The two variables Volume and Washes are perfectly collinear. One of the variables should be dropped from the model (the one with the lower p-value). c. Collinearity has litle effect on the standard errors. OD. Collinearity has no effect on the standard errors. Print Done (d) One of the explanatory variables is just barely statistically significant. Assuming the same estimated value, would a complete lack of collinearity have made this explanatory variable noticeably more statistically significant?
0 Data for Sales Over Time The accompanying data describe sales over time at a franchise outlet of a major U.S. oil company. Each row summarizes sales for one day. This particular stati dollar sales of the convenience store. The explanatory variable Volume gives the number of gallons of gasoline sold, and Washes gives the number of car wash E Click the icon to view the table of data for sales over time. Full data set e Sales Volume Washes Sales Volume Washes B. Car washes because the slope for Washes is larger than the slope for Volume and the daily number of car washes is more than the volume of gallons se c. Gasoline sales because the slope for Volume is larger than the slope for Washes and the daily volume of gallons sold is more than the number of car wa D. Car washes because one car wash costs more than a tank of gas. (Dollars) (Gallons) 3478 3721 3619 2970 3808 3675 3516 3795 (Dollars) (Gallons) 2184 3283 2258 3606 3501 2234 127 95 148 2210 2286 149 222 118 2261 2112 2306 2274 2237 2304 2411 2271 2314 2363 1986 2051 2113 2154 306 294 106 62 2285 1982 2236 2187 2354 2271 2327 1876 2306 2321 2289 2204 1971 2258 2019 2357 2145 3716 2411 3511 3292 271 193 92 256 Do the slopes of these variables in the multiple regression provide the full answer? O A. The slopes do not provide any part of the answer. The answer depends on the p-value corresponding to each explanatory variable. 358 324 279 4014 260 4260 3658 3844 3664 99 OB. The slopes provide the full answer. The larger the (positive) slope, the more that variable contributes to the model. OC. The slopes only provide part of the answer. The volume of gallons of gasoline and the number of car washes per day is also important. 165 169 246 251 316 302 182 3900 177 1952 3807 3872 3731 3367 4052 403 307 168 327 (c) Find the variance inflation factor. 2422 2709 2970 3150 3178 2767 2816 3338 VIF(Volume) = VIF(Washes) = (Round to two decimal places as needed.) 278 2361 Interpret the variance inflation factor. Choose the correct answer below. 2160 2065 2076 2196 271 211 181 3603 2567 4028 3115 240 319 324 185 O A. Collinearity has a significant effect on the standard errors. 38 OB. The two variables Volume and Washes are perfectly collinear. One of the variables should be dropped from the model (the one with the lower p-value). c. Collinearity has litle effect on the standard errors. OD. Collinearity has no effect on the standard errors. Print Done (d) One of the explanatory variables is just barely statistically significant. Assuming the same estimated value, would a complete lack of collinearity have made this explanatory variable noticeably more statistically significant?

Glencoe Algebra 1, Student Edition, 9780079039897, 0079039898, 2018
18th Edition
ISBN:9780079039897
Author:Carter
Publisher:Carter
Chapter8: Polynomials
Section8.1: Adding And Subtracting Polynomials
Problem 58PPS

Related questions

Question
Screenshots provided below
Transcribed Image Text:- X
Data for Sales Over Time
The accompanying data describe sales over time
dollar sales of the convenience store. The explanatory variable Volume gives the number of gallons of gasoline sold, and Washes gives the number of car wash
a franchise outlet of a major U.S. oil company. Each row summarizes sales for one day. This particular static
je
Click the icon to view the table of data for sales over time.
Full data set A
Sales
Volume Washes
Sales
Volume Washes
B. Car washes because the slope for Washes is larger than the slope for Volume and the daily number of car washes is more than the volume of gallons sc
(Dollars) (Gallons)
2210
2286
(Dollars) (Gallons)
3478
149
2184
3283
127
O C. Gasoline sales because the slope for Volume is larger than the slope for Washes and the daily volume of gallons sold is more than the number of car wa
3721
222
2258
3606
95
O D. Car washes because one car wash costs more than a tank of gas.
2261
3619
118
2234
3501
148
2112
2970
306
2285
3716
271
Do the slopes of these variables in the multiple regression provide the full answer?
2306
3808
294
1982
2411
193
2274
3675
106
2236
3511
92
3292
4014
2237
3516
62
2187
O A. The slopes do not provide any part of the answer. The answer depends on the p-value corresponding to each explanatory variable.
256
260
2304
3795
358
2354
O B. The slopes provide the full answer. The larger the (positive) slope, the more that variable contributes to the model.
2411
4260
324
2271
3664
99
2327
1876
2271
3658
279
3900
165
O C. The slopes only provide part of the answer. The volume of gallons of gasoline and the number of car washes per day is also important.
2314
2363
1986
2051
3844
177
1952
169
4052
403
2306
3807
246
(c) Find the variance inflation factor.
2422
2709
251
316
307
2321
3872
3731
3367
168
2289
VIF(Volume) = VIF(Washes) = (Round to two decimal places as needed.)
2113
2154
2160
2065
2076
327
278
2204
1971
2258
2019
302
182
2970
3150
2361
Interpret the variance inflation factor. Choose the correct answer below.
3178
2767
3603
2567
4028
240
319
271
211
181
2357
2145
2816
324
A. Collinearity has a significant effect on the standard errors.
2196
3338
38
3115
185
O B. The two variables Volume and Washes are perfectly collinear. One of the variables should be dropped from the model (the one with the lower p-value).
OC. Collinearity has little effect on the standard errors.
Print
Done
O D. Collinearity has no effect on the standard errors.
(d) One of the explanatory variables is just barely statistically significant. Assuming the same estimated value, would a complete lack of collinearity have made this explanatory variable noticeably more statistically significant?
O A. No, collinearity does not effect the p-values for explanatory variables.
O B. Yes, because the variance inflation factor is not 1.
O C. Yes, because collinearity has a significant impact on the standard errors of the explanatory variables in this problem.
O D. No, there is almost no collinearity.
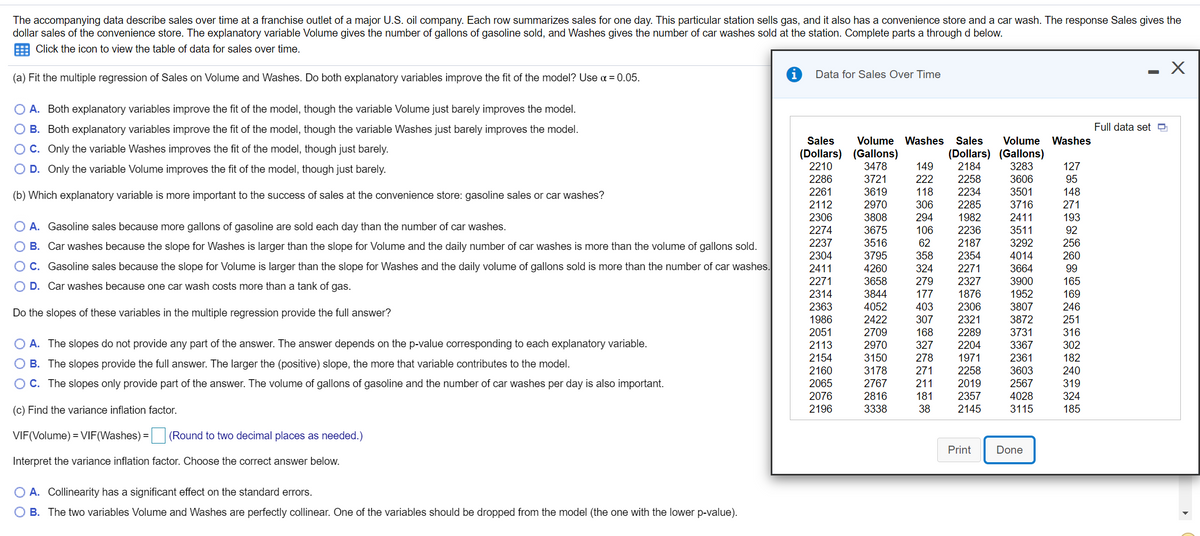
Transcribed Image Text:The accompanying data describe sales over time at a franchise outlet of a major U.S. oil company. Each row summarizes sales for one day. This particular station sells gas, and it also has a convenience store and a car wash. The response Sales gives the
dollar sales of the convenience store. The explanatory variable Volume gives the number of gallons of gasoline sold, and Washes gives the number of car washes sold at the station. Complete parts a through d below.
Click the icon to view the table of data for sales over time.
Data for Sales Over Time
(a) Fit the multiple regression of Sales on Volume and Washes. Do both explanatory variables improve the fit of the model? Use a = 0.05.
O A. Both explanatory variables improve the fit
the model, though the variable Volume just barely improves the model.
O B. Both explanatory variables improve the fit of the model, though the variable Washes just barely improves the model.
Full data set O
Sales
Volume Washes
Sales
Volume
Washes
O C. Only the variable Washes improves the fit of the model, though just barely.
(Dollars) (Gallons)
2210
2286
2261
(Dollars) (Gallons)
2184
2258
2234
2285
149
222
O D. Only the variable Volume improves the fit of the model, though just barely.
3478
3283
127
3721
3606
95
(b) Which explanatory variable is more important to the success of sales at the convenience store: gasoline sales or car washes?
3619
118
3501
148
2112
2970
306
3716
271
2306
2274
3808
294
1982
2411
193
O A. Gasoline sales because more gallons of gasoline are sold each day than the number of car washes.
3675
106
2236
3511
92
Car washes because the slope for Washes is larger than
slope for Volume and the daily number of car washes is more than the volume of gallons
2237
3516
62
2187
3292
256
2304
3795
358
2354
4014
260
O C. Gasoline sales because the slope for Volume is larger than the slope for Washes and the daily volume of gallons sold is more than the number of car washes.
2411
2271
4260
324
2271
3664
99
3658
279
2327
3900
165
O D. Car washes because one car wash costs more than a tank of gas.
2314
3844
177
1876
1952
169
4052
2363
1986
2051
2113
2154
2160
2065
403
2306
3807
246
Do the slopes of these variables in the multiple regression provide the full answer?
2422
307
2321
3872
251
2709
168
2289
3731
316
O A. The slopes do not provide any part of the answer. The answer depends on the p-value corresponding to each explanatory variable.
2970
327
2204
3367
302
3150
278
1971
2361
182
O B. The slopes provide the full answer. The larger the (positive) slope, the more that variable contributes to the model.
3178
271
2258
3603
240
OC. The slopes only provide part of the answer. The volume of gallons of gasoline and the number of car washes per day is also important.
2767
211
2019
2567
319
2076
2816
181
2357
4028
324
(c) Find the variance inflation factor.
2196
3338
38
2145
3115
185
VIF(Volume) = VIF(Washes) = (Round to two decimal places as needed.)
Print
Done
Interpret the variance inflation factor. Choose the correct answer below.
O A. Collinearity has a significant effect on the standard errors.
O B. The two variables Volume and Washes are perfectly collinear. One of the variables should be dropped from the model (the one with the lower p-value).
Expert Solution
This question has been solved!
Explore an expertly crafted, step-by-step solution for a thorough understanding of key concepts.

This is a popular solution!

Trending now
This is a popular solution!

Step by step
Solved in 2 steps

Knowledge Booster


Learn more about
Need a deep-dive on the concept behind this application? Look no further. Learn more about this topic, statistics and related others by exploring similar questions and additional content below.Recommended textbooks for you
Glencoe Algebra 1, Student Edition, 9780079039897…
Algebra
ISBN:
9780079039897
Author:
Carter
Publisher:
McGraw Hill

Big Ideas Math A Bridge To Success Algebra 1: Stu…
Algebra
ISBN:
9781680331141
Author:
HOUGHTON MIFFLIN HARCOURT
Publisher:
Houghton Mifflin Harcourt

Algebra & Trigonometry with Analytic Geometry
Algebra
ISBN:
9781133382119
Author:
Swokowski
Publisher:
Cengage
Glencoe Algebra 1, Student Edition, 9780079039897…
Algebra
ISBN:
9780079039897
Author:
Carter
Publisher:
McGraw Hill
Big Ideas Math A Bridge To Success Algebra 1: Stu…
Algebra
ISBN:
9781680331141
Author:
HOUGHTON MIFFLIN HARCOURT
Publisher:
Houghton Mifflin Harcourt
Algebra & Trigonometry with Analytic Geometry
Algebra
ISBN:
9781133382119
Author:
Swokowski
Publisher:
Cengage


Algebra: Structure And Method, Book 1
Algebra
ISBN:
9780395977224
Author:
Richard G. Brown, Mary P. Dolciani, Robert H. Sorgenfrey, William L. Cole
Publisher:
McDougal Littell

Trigonometry (MindTap Course List)
Trigonometry
ISBN:
9781337278461
Author:
Ron Larson
Publisher:
Cengage Learning