(0) The misery index is defined as the sum of the unemployment rate and the inflation rate. According to the misery index, which year was more "miserable," year 17 or year 19? The misery index for year 17 was approximately % and for year 19 approximately %, so year was more "miserable." (Type integers or decimals rounded to one decimal place as needed.)
(0) The misery index is defined as the sum of the unemployment rate and the inflation rate. According to the misery index, which year was more "miserable," year 17 or year 19? The misery index for year 17 was approximately % and for year 19 approximately %, so year was more "miserable." (Type integers or decimals rounded to one decimal place as needed.)

Algebra & Trigonometry with Analytic Geometry
13th Edition
ISBN:9781133382119
Author:Swokowski
Publisher:Swokowski
Chapter5: Inverse, Exponential, And Logarithmic Functions
Section5.3: The Natural Exponential Function
Problem 40E

Related questions
Question
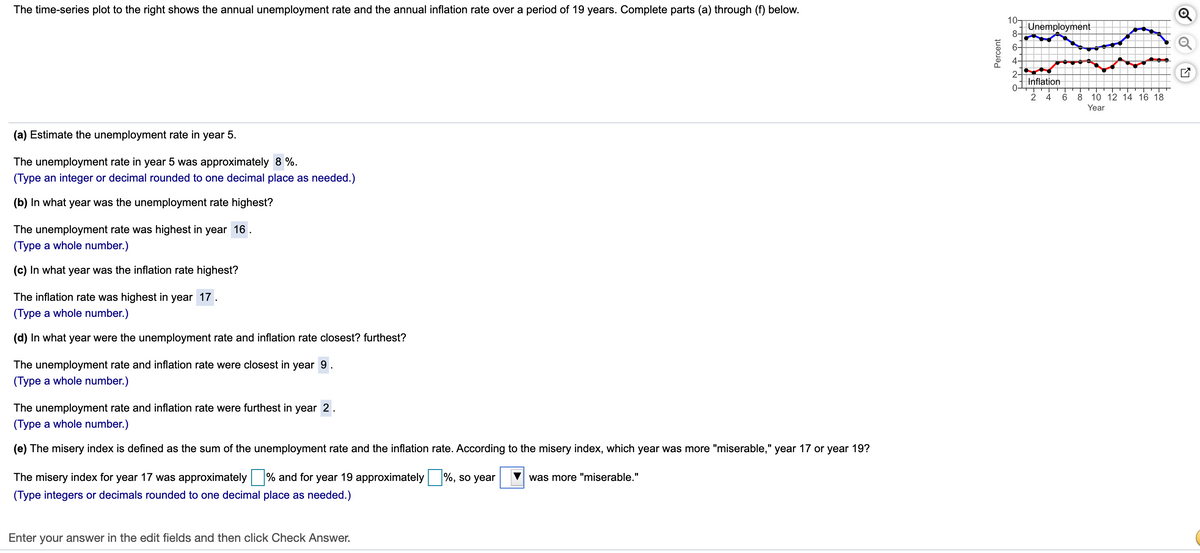
Transcribed Image Text:The time-series plot to the right shows the annual unemployment rate and the annual inflation rate over a period of 19 years. Complete parts (a) through (f) below.
10-
Unemployment
8-
6-
4-
2-
Inflation
2 4
6
8 10 12 14 16 18
Year
(a) Estimate the unemployment rate in year 5.
The unemployment rate in year 5 was approximately 8 %.
(Type an integer or decimal rounded to one decimal place as needed.)
(b) In what year was the unemployment rate highest?
The unemployment rate was highest in year 16
(Type a whole number.)
(c) In what year was the inflation rate highest?
The inflation rate was highest in year 17.
(Type a whole number.)
(d) In what year were the unemployment rate and inflation rate closest? furthest?
The unemployment rate and inflation rate were closest in year 9
(Type a whole number.)
The unemployment rate and inflation rate were furthest in year 2.
(Type a whole number.)
(e) The misery index is defined as the sum of the unemployment rate and the inflation rate. According to the misery index, which year was more "miserable," year 17 or year 19?
The misery index for year 17 was approximately % and for
(Type integers or decimals rounded to one decimal place as needed.)
year 19 approximately
%, so year
was more "miserable."
Enter your answer in the edit fields and then click Check Answer.
Percent
of
Expert Solution
This question has been solved!
Explore an expertly crafted, step-by-step solution for a thorough understanding of key concepts.

This is a popular solution!

Trending now
This is a popular solution!

Step by step
Solved in 2 steps

Knowledge Booster


Learn more about
Need a deep-dive on the concept behind this application? Look no further. Learn more about this topic, statistics and related others by exploring similar questions and additional content below.Recommended textbooks for you
Algebra & Trigonometry with Analytic Geometry
Algebra
ISBN:
9781133382119
Author:
Swokowski
Publisher:
Cengage

Algebra & Trigonometry with Analytic Geometry
Algebra
ISBN:
9781133382119
Author:
Swokowski
Publisher:
Cengage