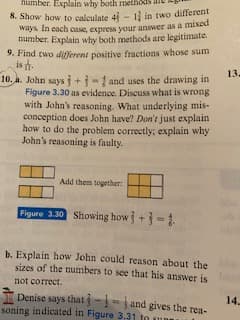
0. a. John says + -1 and uses the drawing in Figure 3.30 as evidence. Discuss what is wrong with John's reasoning, What underlying mis- conception does John have? Don't just explain how to do the problem correctly; explain why John's reasoning is faulty. Add them together Figure 3.30 Showing how +-1


Contingency Table
A contingency table can be defined as the visual representation of the relationship between two or more categorical variables that can be evaluated and registered. It is a categorical version of the scatterplot, which is used to investigate the linear relationship between two variables. A contingency table is indeed a type of frequency distribution table that displays two variables at the same time.
Binomial Distribution
Binomial is an algebraic expression of the sum or the difference of two terms. Before knowing about binomial distribution, we must know about the binomial theorem.
The bottom of the rest of the question was cut off. It is meant to say
16 x 25 = some expression
= .
.
.
= some expression


Trending now
This is a popular solution!

Step by step
Solved in 2 steps with 2 images


