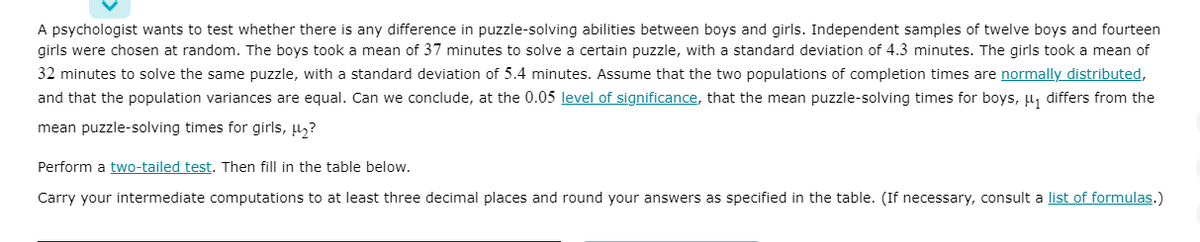
A psychologist wants to test whether there is any difference in puzzle-solving abilities between boys and girls. Independent samples of twelve boys and fourteen girls were chosen at random. The boys took a mean of 37 minutes to solve a certain puzzle, with a standard deviation of 4.3 minutes. The girls took a mean of 32 minutes to solve the same puzzle, with a standard deviation of 5.4 minutes. Assume that the two populations of completion times are normally distributed, and that the population variances are equal. Can we conclude, at the 0.05 level of significance, that the mean puzzle-solving times for boys, u, differs from the mean puzzle-solving times for girls, µz? Perform a two-tailed test. Then fill in the table below. Carry your intermediate computations to at least three decimal places and round your answers as specified in the table. (If necessary, consult a list of formulas.)
A psychologist wants to test whether there is any difference in puzzle-solving abilities between boys and girls. Independent samples of twelve boys and fourteen girls were chosen at random. The boys took a mean of 37 minutes to solve a certain puzzle, with a standard deviation of 4.3 minutes. The girls took a mean of 32 minutes to solve the same puzzle, with a standard deviation of 5.4 minutes. Assume that the two populations of completion times are normally distributed, and that the population variances are equal. Can we conclude, at the 0.05 level of significance, that the mean puzzle-solving times for boys, u, differs from the mean puzzle-solving times for girls, µz? Perform a two-tailed test. Then fill in the table below. Carry your intermediate computations to at least three decimal places and round your answers as specified in the table. (If necessary, consult a list of formulas.)

MATLAB: An Introduction with Applications
6th Edition
ISBN:9781119256830
Author:Amos Gilat
Publisher:Amos Gilat
Chapter1: Starting With Matlab
Section: Chapter Questions
Problem 1P

Related questions
Topic Video
Question
100%
Transcribed Image Text:A psychologist wants to test whether there is any difference in puzzle-solving abilities between boys and girls. Independent samples of twelve boys and fourteen
girls were chosen at random. The boys took a mean of 37 minutes to solve a certain puzzle, with a standard deviation of 4.3 minutes. The girls took a mean of
32 minutes to solve the same puzzle, with a standard deviation of 5.4 minutes. Assume that the two populations of completion times are normally distributed,
and that the population variances are equal. Can we conclude, at the 0.05 level of significance, that the mean puzzle-solving times for boys, µ, differs from the
mean puzzle-solving times for girls, µ,?
Perform a two-tailed test. Then fill in the table below.
Carry your intermediate computations to at least three decimal places and round your answers as specified in the table. (If necessary, consult a list of formulas.)
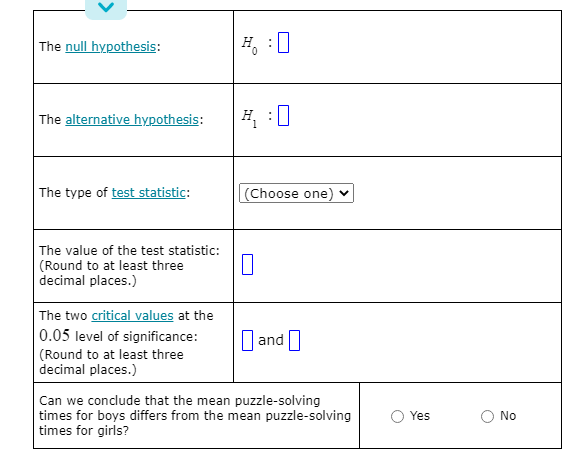
Transcribed Image Text:The null hypothesis:
H.
The alternative hypothesis:
H :0
The type of test statistic:
(Choose one) v
The value of the test statistic:
(Round to at least three
decimal places.)
The two critical values at the
0.05 level of significance:
(Round to at least three
decimal places.)
||and|
Can we conclude that the mean puzzle-solving
times for boys differs from the mean puzzle-solving
times for girls?
Yes
No
Expert Solution
This question has been solved!
Explore an expertly crafted, step-by-step solution for a thorough understanding of key concepts.

This is a popular solution!

Trending now
This is a popular solution!

Step by step
Solved in 2 steps

Follow-up Questions
Read through expert solutions to related follow-up questions below.
Knowledge Booster


Learn more about
Need a deep-dive on the concept behind this application? Look no further. Learn more about this topic, statistics and related others by exploring similar questions and additional content below.Recommended textbooks for you
MATLAB: An Introduction with Applications
Statistics
ISBN:
9781119256830
Author:
Amos Gilat
Publisher:
John Wiley & Sons Inc

Probability and Statistics for Engineering and th…
Statistics
ISBN:
9781305251809
Author:
Jay L. Devore
Publisher:
Cengage Learning

Statistics for The Behavioral Sciences (MindTap C…
Statistics
ISBN:
9781305504912
Author:
Frederick J Gravetter, Larry B. Wallnau
Publisher:
Cengage Learning
MATLAB: An Introduction with Applications
Statistics
ISBN:
9781119256830
Author:
Amos Gilat
Publisher:
John Wiley & Sons Inc
Probability and Statistics for Engineering and th…
Statistics
ISBN:
9781305251809
Author:
Jay L. Devore
Publisher:
Cengage Learning
Statistics for The Behavioral Sciences (MindTap C…
Statistics
ISBN:
9781305504912
Author:
Frederick J Gravetter, Larry B. Wallnau
Publisher:
Cengage Learning

Elementary Statistics: Picturing the World (7th E…
Statistics
ISBN:
9780134683416
Author:
Ron Larson, Betsy Farber
Publisher:
PEARSON

The Basic Practice of Statistics
Statistics
ISBN:
9781319042578
Author:
David S. Moore, William I. Notz, Michael A. Fligner
Publisher:
W. H. Freeman

Introduction to the Practice of Statistics
Statistics
ISBN:
9781319013387
Author:
David S. Moore, George P. McCabe, Bruce A. Craig
Publisher:
W. H. Freeman