0.05 0.07 0.09 0.11 0.13 0.15 0.17 0.19 0.21 0.23 0.25 Proportion Age 65+ (n=100) 0.05 0.07 0.09 0.11 0.13 0.15 0.17 0.19 0.21 0.23 0.25 Proportion Age 65+ (n=1000)
0.05 0.07 0.09 0.11 0.13 0.15 0.17 0.19 0.21 0.23 0.25 Proportion Age 65+ (n=100) 0.05 0.07 0.09 0.11 0.13 0.15 0.17 0.19 0.21 0.23 0.25 Proportion Age 65+ (n=1000)

Chapter9: Sequences, Probability And Counting Theory
Section9.7: Probability
Problem 1SE: What term is used to express the likelihood of an event occurring? Are there restrictions on its...

Related questions

Question
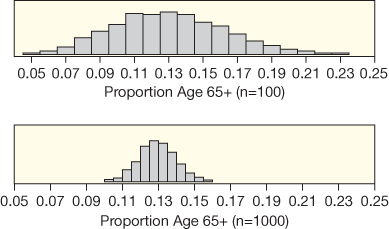
What Percent of the US Population Are Senior Citizens?
People 65 years and older are the fastest growing segment of the US population, and constituted 13% of the population in 2010.17 Figure 3.9 shows sample proportions from two sampling distributions of the proportion 65 years and older in the US: One shows samples of size 100, and the other shows samples of size 1000.
Suppose you take one more sample in each case. Would a sample proportion of 0.17 (that is, 17% senior citizens in the sample) be surprising to see from a sample of size 100? Would it be surprising from a sample of size 1000?
Transcribed Image Text:0.05 0.07 0.09 0.11 0.13 0.15 0.17 0.19 0.21 0.23 0.25
Proportion Age 65+ (n=100)
0.05 0.07 0.09 0.11 0.13 0.15 0.17 0.19 0.21 0.23 0.25
Proportion Age 65+ (n=1000)
Expert Solution
This question has been solved!
Explore an expertly crafted, step-by-step solution for a thorough understanding of key concepts.

This is a popular solution!

Trending now
This is a popular solution!

Step by step
Solved in 2 steps

Knowledge Booster


Learn more about
Need a deep-dive on the concept behind this application? Look no further. Learn more about this topic, statistics and related others by exploring similar questions and additional content below.Recommended textbooks for you

College Algebra
Algebra
ISBN:
9781305115545
Author:
James Stewart, Lothar Redlin, Saleem Watson
Publisher:
Cengage Learning
College Algebra
Algebra
ISBN:
9781305115545
Author:
James Stewart, Lothar Redlin, Saleem Watson
Publisher:
Cengage Learning