0.40- 0.35- 0.30- 0.25- 0.20- 0.15 0.10- 0.05- 500 1,000 1,500 2,000 2,500 Value (thousands of dollars) Relative Frequency :...! 400 500 600 700 800 900 1,000 1,100 Sample Midrange (thousands of dollars)


Inverse Normal Distribution
The method used for finding the corresponding z-critical value in a normal distribution using the known probability is said to be an inverse normal distribution. The inverse normal distribution is a continuous probability distribution with a family of two parameters.
Mean, Median, Mode
It is a descriptive summary of a data set. It can be defined by using some of the measures. The central tendencies do not provide information regarding individual data from the dataset. However, they give a summary of the data set. The central tendency or measure of central tendency is a central or typical value for a probability distribution.
Z-Scores
A z-score is a unit of measurement used in statistics to describe the position of a raw score in terms of its distance from the mean, measured with reference to standard deviation from the mean. Z-scores are useful in statistics because they allow comparison between two scores that belong to different normal distributions.
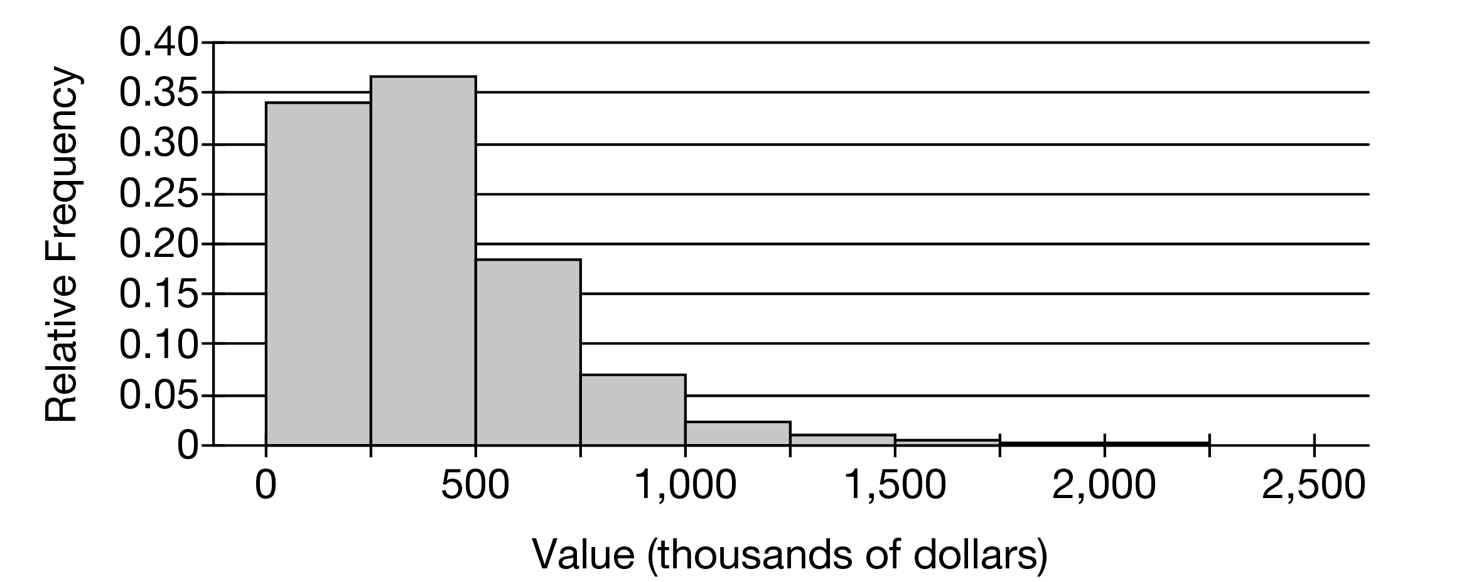
The following histogram shows the distribution of house values in a certain city. The mean of the distribution is $403,000 and the standard deviation is $278,000.
(a) Suppose one house from the city will be selected at random. Use the histogram to estimate the probability that the selected house is valued at less than $500,000. Show your work.
(b) Suppose a random sample of 40 houses are selected from the city. Estimate the probability that the
To estimate a population mean μ, the sample mean x¯ is often used as an estimator. However, a different estimator is called the sample midrange, given by the formula sample minimum + sample maximum2.
(c) The following table shows the values, in thousands of dollars, of 40 randomly selected houses in the city.
| 34 | 38 | 95 | 110 | 137 | 140 | 155 | 155 | 169 | 207 |
| 209 | 217 | 274 | 314 | 314 | 323 | 343 | 347 | 349 | 363 |
| 369 | 373 | 388 | 389 | 397 | 416 | 448 | 450 | 483 | 487 |
| 488 | 516 | 571 | 595 | 600 | 738 | 762 | 769 | 863 | 1,084 |
(i) Calculate the sample midrange for the data.
(ii) Explain why the sample midrange might be preferred to the sample mean as an estimator of the population mean.
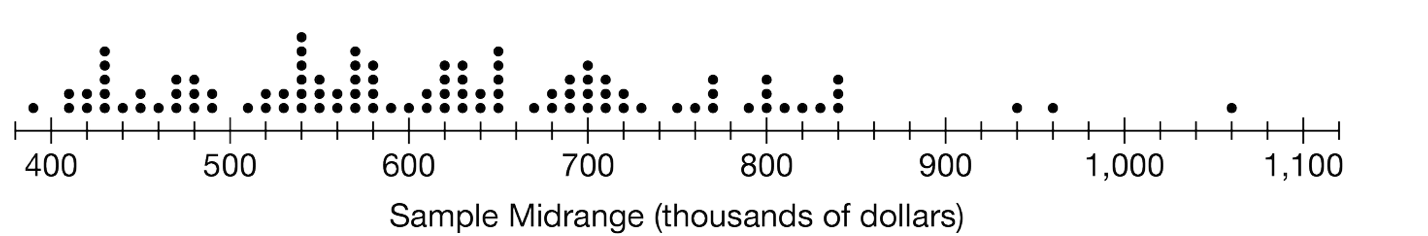
(d) To investigate the sampling distribution of the sample midrange, a simulation is performed in which 100 random samples of size n=40 were selected from the population of house values. For each sample, the sample midrange was calculated and recorded on the following dotplot. The mean of the distribution of sample midranges is $617,000 with standard deviation $136,000.
Based on the results of the simulation, explain why the sample mean might be preferred to the sample midrange as an estimator of the population mean.


Trending now
This is a popular solution!

Step by step
Solved in 3 steps with 3 images


