0.9 0.8 0.7 0.6 0.5 0.4 0.3 0.2 0.1 0.05 0.1 0.15 0.2 0.25 0.3


Q: A control chart for the number of nonconforming cell phone cases is maintained on a plastic molding…
A: Given information: np = 16.0 n = 100 np=16p=16n=16100=0.16…
Q: Table 3- Failure Rates of Transistors in Computers End of week Probability of failure to date 0.08…
A: The calculation of replacement cost by individual replacement method can be done using easy…
Q: Test the claim that the proportion of people who own cats is larger than 90% at the 0.01…
A:
Q: Assume the above life table was constructed from following individuals who were diagnosed with a…
A:
Q: An observation that deviates from the pattern in the rest of the data Choose the correct answer…
A: In the following options, a sample that deviates from the rest is given below.
Q: 3. Suppose that the number of system failures each month has a Poisson distribution with average 0.…
A:
Q: A researcher first decided to conduct a two-tailed hypothesis test, with alpha = .05, but then…
A:
Q: The probability of the data under the model of the alternative hypothesis (model 1) is 0.0008 and…
A:
Q: c) A sample of 20 observations was divided into two equal sets after arranging for the independent…
A: Goldfeld Quandt Test : In regression analysis, the Goldfeld–Quandt test is used to check for…
Q: A researcher is forced to collect data from a smaller sample of individuals to test their research…
A: In this case, we need to fill the blank in the given statement.
Q: A hunger-relief organization is trying to determine the lowest likely proportion of the local…
A:
Q: The table below shows the yields in bushels per acre of a certain variety of wheat grown in a…
A: ANOVA: ANOVA is useful method to check the Significance difference between the two or more than two…
Q: Test the claim that the proportion of people who own cats is smaller than 10% at the 0.025…
A:
Q: The maximum acceptable level of a certain toxic chemical in vegetables has been set at 0.6 parts per…
A: We have find givan hypothesis...
Q: Suppose that the relevant equilibrium model is CAPM with unlimited borrowing and lending at a…
A:
Q: (e) Assuming that the four potential outliers of 0, 0, 8, and 20 are not recording errors, repeat…
A: Note: As per guidelines we will solve the first question only, please repost other questions for…
Q: Find the maximum likelihood estimator of e".
A: # Given: n iid random variable from pdf f(x)=e^(-x+mu-e^(-x+mu)) X from real number then to find…
Q: The table below indicates an urban zone's expected houschold composition at some future year and the…
A: Given,A table that shows an urban zone's expected household composition.To find: Total…
Q: An agronomist believes that a newly developed fertilizer will increase the mea than 2.5 kg. 56 plats…
A: Given
Q: The management of Brinkley Corporation is interested in using simulation to estimate the profit per…
A:
Q: You can lower the likelihood of making a Type I error by: raising the alpha level to 0.10…
A: Type I error: Type I error occurs when rejecting the null hypothesis when it is true. If the null…
Q: The probability is 0.6 that a calibration of a transducer in an electronic instrument conforms to…
A:
Q: The selection of our alpha level is directly related to the likelihood of making a type I error.…
A: In hypothesis testing the Type I error is said to be committed when true null hypothesis is…
Q: Suppose a new production method will be implemented if a hypothesis test supports the conclusion…
A: The claim is that the mean cost for the current production method is $280 per hour.
Q: Your investment executive claims that the average yearly rate of return on the stocks she recommends…
A: Given claim: Your investment executive claims that the average yearly rate of return on the stocks…
Q: Consider five design alternatives for guitar strings. The cost and expected life of each design are…
A: Let X be a random variable such that X: lifetime of strings in hours before failure. X~ExpλEX=1λ We…
Q: Suppose a new production method will be implemented if a hypothesis test supports the conclusion…
A: a) Consider that μ defines the population mean cost.
Q: When having a baby, assume that the probability of having a boy is 50% and the probability of having…
A: Amswer: See the answer below:
Q: A proposed project has the following cash flow estimates. Assuming independent cash flows, a…
A: (a) Mean of NPV…
Q: Consider the CAPM. The risk-free rate is 1% and the expected return on the market is 14%. What is…
A:
Q: A band limited white noise has a single sided PSD of 100 over the frequency range of 1 to 26 hz.…
A: Given : White noise has a single sided PSD of 100 over frequency range of 1 to 26 hz. PSD = 100
Q: Which assumption of the least-squares estimation is violated when the error term is heteroscedastic?…
A: In regression analysis, heteroscedasticity means unequal scattering. It refers to a situation where…
Q: Amphibian populations are in decline worldwide due to the increasing prevalence of ranavirus…
A:
Q: Suppose that a portfolio consists of two assets A and B whose returns are given by RA = RM + uA and…
A: Please see the attachement..........
Q: Show that the sample proportion X n is a minimumvariance unbiased estimator of the binomial…
A: Hello, Thanks for posting your question here. I believe the sample proportion is X/n while copying…
Q: O a. Yes, conducting a hypothesis test using the t-distribution would be appropriate. O b. No,…
A: We have given that the data represented in two graphs histogram and box plot.
Q: By comparing Tables Six and Nine, discuss the impacts on the estimation results if…
A: Table 6: Model with no presence of heteroskedasticity. Decision Rule: If p-value ≤ α, then the…
Q: A researcher wishes to see of the way people to obtain information is independent od their…
A:
Q: 3.3 A new internet provider claims that using their system you can get transmission speeds of 400…
A:
Q: 1. A report in LTO stated that the average age of taxis in the Philippines is 9 years. An operations…
A:
Q: If a point on a control chart falls outside one of the control limits, this suggests that the…
A: When one point of the control limits is surpassed, the mechanism is considered to be out of control.…
Q: 3. A scientist predicts that the kittens born with a congenital birth defect will be 25% based on…
A: Chi square statistics can be used to test the goodness of fit and independence. The test statistic…
Q: Find the Maximum Likelihood estimator of the parameter p?
A: We obtain maximum likelihood estimator by maximizing the likelihood function.
Q: 9. The maximum acceptable level of a certain toxic chemical in vegetables has been set at 0.4 parts…
A:
Q: uppose in a hypothesis testing, we obtained a pp-value of 0.003. Which of the following is/are…
A: he correct is D that is this pp value indicates a big effect size. p value is basically the is the…
Q: A book seller has the following schedule of weekly. demand for the book "Elementary Quantitative…
A:
Q: A proposed project has the following cash flow estimates.Assuming statistically independent cash…
A: a. The mean and standard deviation of net present value: Mean of net present value=∑t=02At1+it Mean…
Q: A manager is contemplating using Rules 1 and 4 for determining out-of-control conditions. Suppose…
A: The given information is indicating towards "Normal Distribution". In other aspect the sample size…
Q: If a treatment is expected to increase scores among a population with u= 20, then the alternative…
A: HERE CLAIM IS MEAN WILL BE INCREASED TO IT IS GREATER THAN 20 CLAIM IS REPRESNTED IN ALTERNATIVE…
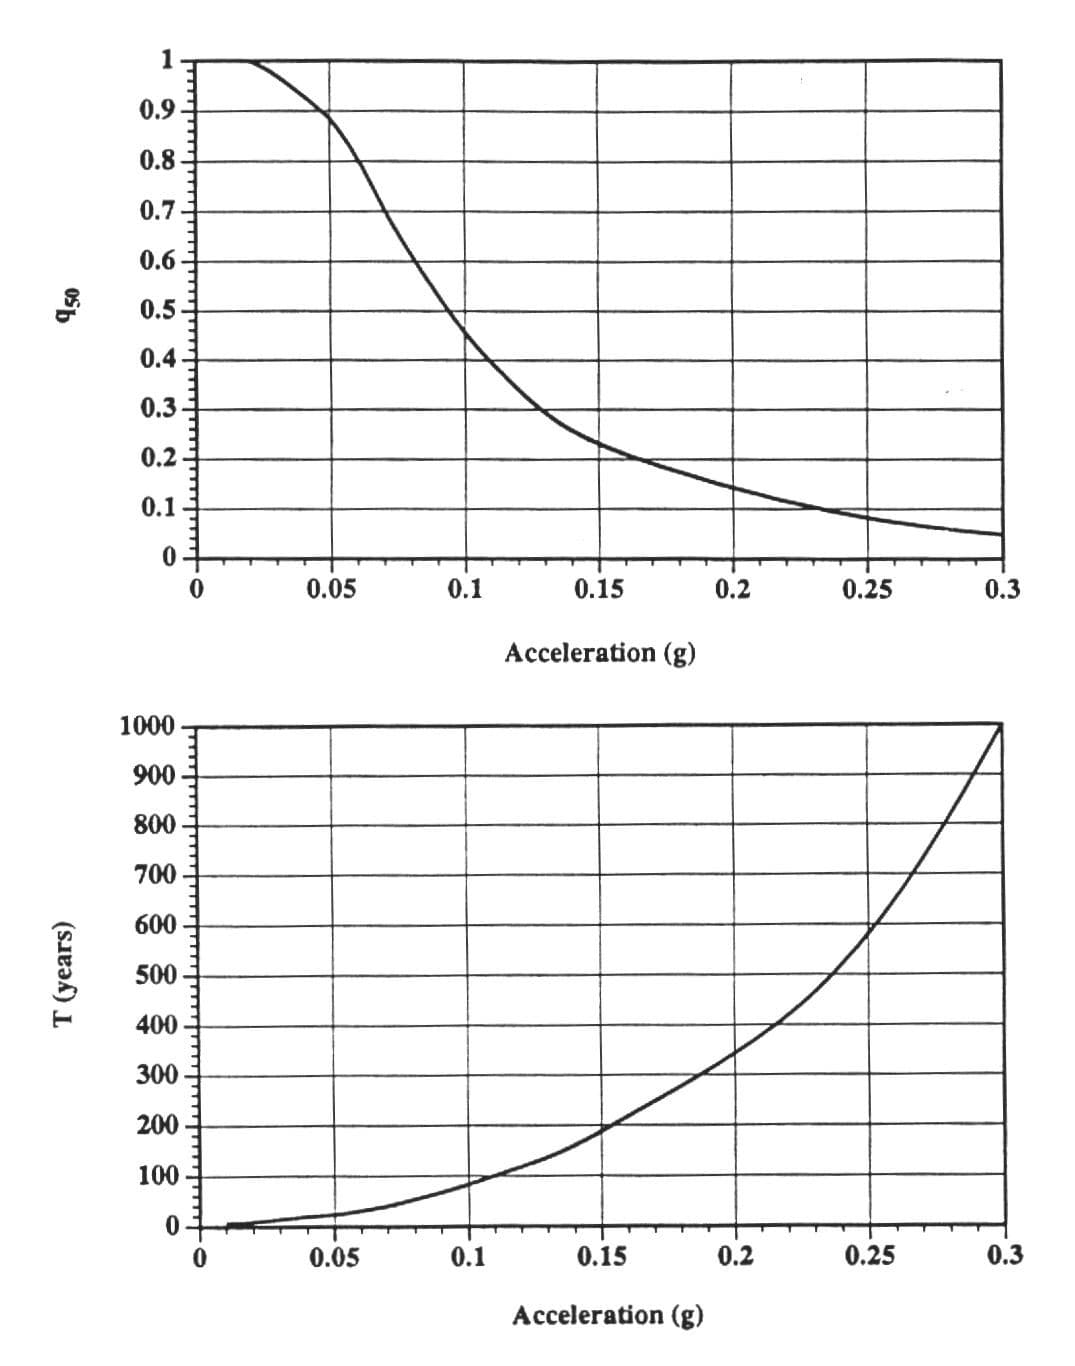
Analyse the hazard curve in figure 1 and find out the probability of exceedance of a PGA 0.1g in 50years. Design life of structure is 50years.


Trending now
This is a popular solution!

Step by step
Solved in 3 steps with 2 images

- Table 6 shows the population, in thousands, of harbor seals in the Wadden Sea over the years 1997 to 2012. a. Let x represent time in years starting with x=0 for the year 1997. Let y represent the number of seals in thousands. Use logistic regression to fit a model to these data. b. Use the model to predict the seal population for the year 2020. c. To the nearest whole number, what is the limiting value of this model?The fox population in a certain region has an annualgrowth rate of 9 per year. In the year 2012, therewere 23,900 fox counted in the area. What is the foxpopulation predicted to be in the year 2020 ?Suppose an investment account is opened with aninitial deposit of 10,500 earning 6.25 interest,compounded continuously. How much will theaccount be warm after 25 years?
- The number of cases within 3 days due to coronavirus is as follows: 21 May 2020: 961 New Case 22 May 2020: 952 New Case 23 May 2020: 1186 New Case 1a) Calculate the growth rate according to this information and express this variable as X = Aert. 2a) Using the answer 1a, Make a prediction for the previous and next day of the end date you use in your calculations.The quoted futures price corresponds to a forward rate of 8% per annum with quarterly compounding and actual/360. The parameters for Black’s model are therefore:Fk = 0.08, K=0.08, R=0.075, tk=0.75, SDk=0.15and P(0,tk+1)=e-0.075x1=0.9277 . Use these information to estimate the call price.It has been estimated that the population of Indianapolis is growing at a rate of 0.9% per year. Assuming that population growth continues at this rate and the population of Indianapolis was 1,988,817 in January of 2016, estimate the expected population of Indianapolis in January of 2020. Round your answer to the nearest whole person. Do not include units on your answer.
- Suppose that a firm's sales were $3,750,000 five years ago and are $5,250,000 today. What was the geometric mean growth rate in sales over the past five years?Annual revenue for Corning Supplies grew by 5.5% in 2010, 1.1% in 2011, -3.5% in 2012, -1.1% in 2013,and 1.8% in 2014. What is the mean growth annual rate over this period?The following table contains the demand from the last 10 months. Calculate the exponential smoothing with trend forecast for these data, using an α of 0.30, a δ of 0.30, an initial trend forecast (T1) of 1, and an initial exponentially smoothed forecast (F1) of 30. Round your intermediate calculations and answers to two decimal places.
- What is the adjusted Exponential Smoothing forecast for Year 4, Q1 using alpha = 0.3 and beta = 0.5? What is the predicted annual demand for year 4? What is the seasonally adjusted forecast for year 4, Q1?t Date Rate 1 1-Apr-04 1.8564 2 2-Apr-04 1.8293 3 5-Apr-04 1.8140 4 6-Apr-04 1.8374 5 7-Apr-04 1.8410 6 8-Apr-04 1.8325 7 9-Apr-04 1.8322 8 12-Apr-04 1.8358 9 13-Apr-04 1.8160 10 14-Apr-04 1.7902 11 15-Apr-04 1.7785 12 16-Apr-04 1.8004 13 19-Apr-04 1.8055 14 20-Apr-04 1.7914 15 21-Apr-04 1.7720 16 22-Apr-04 1.7684 17 23-Apr-04 1.7674 18 26-Apr-04 1.7857 19 27-Apr-04 1.7925 20 28-Apr-04 1.7720 21 29-Apr-04 1.7751 22 30-Apr-04 1.7744 23 3-May-04 1.7720 24 4-May-04 1.7907 25 5-May-04 1.7932 26 6-May-04 1.7941 27 7-May-04 1.7842 28 10-May-04 1.7723 29 11-May-04 1.7544 30 12-May-04 1.7743 31 13-May-04 1.7584 32 14-May-04 1.7572 33 17-May-04 1.7695 34 18-May-04 1.7695 35 19-May-04 1.7827 36 20-May-04 1.7710 37 21-May-04 1.7880 38 24-May-04 1.7908 39 25-May-04 1.8135 40 26-May-04 1.8142 41 27-May-04 1.8369 42 28-May-04 1.8330 (a) Make a line chart and fit an m-period moving average to the exchange rate…The following table reports the percentage of stocks in a portfolio for nine quarters: a. Construct a time series plot. What type of pattern exists in the data?b. Use trial and error to find a value of the exponential smoothing coefficient a thatresults in a relatively small MSE.c. Using the exponential smoothing model you developed in part b, what is the forecastof the percentage of stocks in a typical portfolio for the second quarter of year 3?
