(e) Assuming that the four potential outliers of 0, 0, 8, and 20 are not recording errors, repeat the hypothesis test from part (c) (again setting up the hypothesis test and using either the critical value or p-value approach), and compare your results with that obtained in (c). Did you make a different conclusion?
(e) Assuming that the four potential outliers of 0, 0, 8, and 20 are not recording errors, repeat the hypothesis test from part (c) (again setting up the hypothesis test and using either the critical value or p-value approach), and compare your results with that obtained in (c). Did you make a different conclusion?

College Algebra
7th Edition
ISBN:9781305115545
Author:James Stewart, Lothar Redlin, Saleem Watson
Publisher:James Stewart, Lothar Redlin, Saleem Watson
Chapter1: Equations And Graphs
Section: Chapter Questions
Problem 10T: Olympic Pole Vault The graph in Figure 7 indicates that in recent years the winning Olympic men’s...

Related questions
Question
Transcribed Image Text:11:15 PM Sat Jul 23
< 88 Q
X
Lesson 45-47 Week 9
X
MATH140 - Statistical Project #2
Lecture 41-44 Week 8
☆.
X
O
T
Hw 10
X MATH140 - Statistical...
(e) Assuming that the four potential outliers of 0, 0, 8, and 20 are not recording errors, repeat the
hypothesis test from part (c) (again setting up the hypothesis test and using either the critical
value or p-value approach), and compare your results with that obtained in (c). Did you make a
different conclusion?
40%
(f) Imagine you know have to make a recommendation/conclusion to the company that hired you:
Assuming that the four potential outlies are not recording errors, and looking at the two results
above, would you recommend using the first test with the outliers or the second test with the
outliers removed? There is no right or wrong answer here, I am interested in what you think and
your reasoning.
Transcribed Image Text:11:14 PM Sat Jul 23
< 88 a a
X
Lesson 45-47 Week 9
a
C
X
MATH140 - Statistical Project #2
Lecture 41-44 Week 8
Frequency
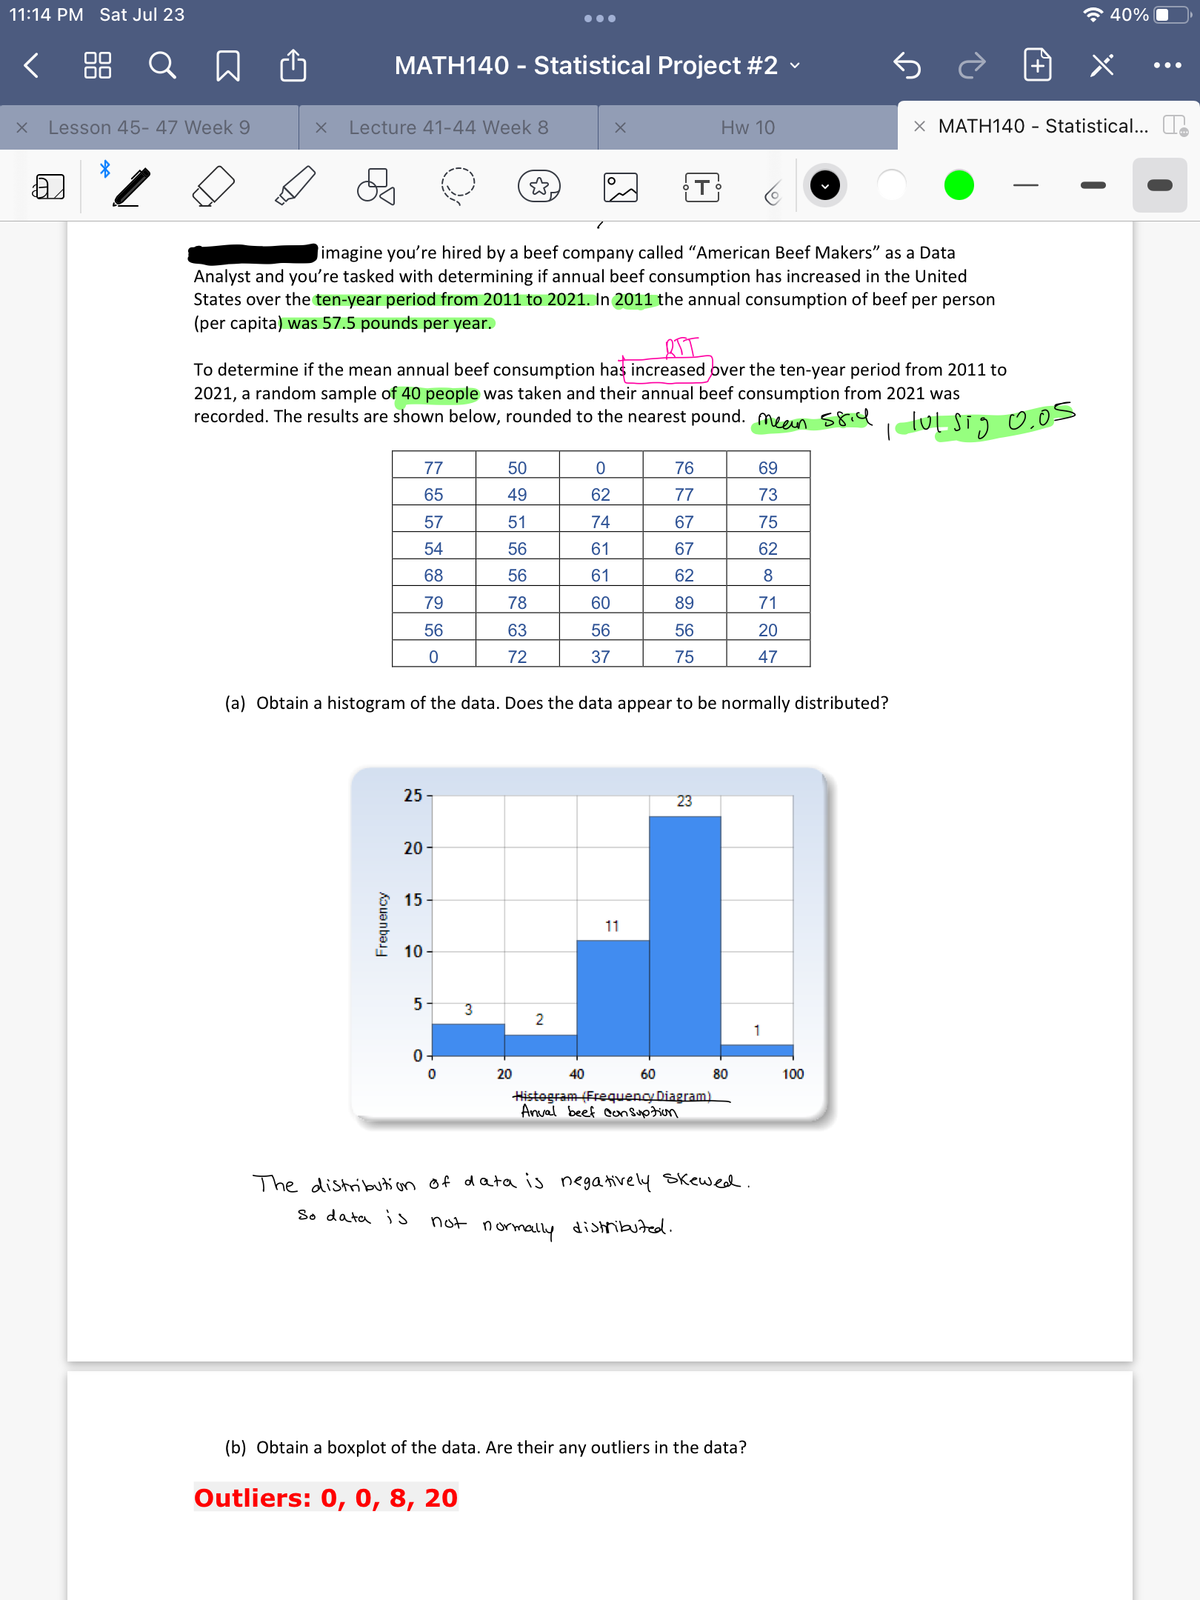
imagine you're hired by a beef company called "American Beef Makers" as a Data
Analyst and you're tasked with determining if annual beef consumption has increased in the United
States over the ten-year period from 2011 to 2021. In 2011 the annual consumption of beef per person
(per capita) was 57.5 pounds per year.
77
65
20
RIT
To determine if the mean annual beef consumption has increased over the ten-year period from 2011 to
2021, a random sample of 40 people was taken and their annual beef consumption from 2021 was
recorded. The results are shown below, rounded to the nearest pound. Mean 58.4
1 101 sig 0.05
57
54
68
79
56
0
25-
15
10-
5
0-
0
3
50
49
51
56
56
78
63
72
(a) Obtain a histogram of the data. Does the data appear to be normally distributed?
not
20
2
O
X
40
0
62
normally
74
61
61
60
56
37
T
11
60
76
77
67
67
62
89
56
75
Hw 10
Histogram (Frequency Diagram)
Anval beef consuption
23
distributed.
The distribution of data is negatively skewed.
So data is
80
69
73
75
62
8
71
20
47
(b) Obtain a boxplot of the data. Are their any outliers in the data?
Outliers: 0, 0, 8, 20
1
X MATH140 - Statistical...
100
40%
Expert Solution
This question has been solved!
Explore an expertly crafted, step-by-step solution for a thorough understanding of key concepts.

This is a popular solution!

Trending now
This is a popular solution!

Step by step
Solved in 3 steps

Recommended textbooks for you
College Algebra
Algebra
ISBN:
9781305115545
Author:
James Stewart, Lothar Redlin, Saleem Watson
Publisher:
Cengage Learning

Linear Algebra: A Modern Introduction
Algebra
ISBN:
9781285463247
Author:
David Poole
Publisher:
Cengage Learning

Functions and Change: A Modeling Approach to Coll…
Algebra
ISBN:
9781337111348
Author:
Bruce Crauder, Benny Evans, Alan Noell
Publisher:
Cengage Learning
College Algebra
Algebra
ISBN:
9781305115545
Author:
James Stewart, Lothar Redlin, Saleem Watson
Publisher:
Cengage Learning
Linear Algebra: A Modern Introduction
Algebra
ISBN:
9781285463247
Author:
David Poole
Publisher:
Cengage Learning
Functions and Change: A Modeling Approach to Coll…
Algebra
ISBN:
9781337111348
Author:
Bruce Crauder, Benny Evans, Alan Noell
Publisher:
Cengage Learning

Algebra & Trigonometry with Analytic Geometry
Algebra
ISBN:
9781133382119
Author:
Swokowski
Publisher:
Cengage

Glencoe Algebra 1, Student Edition, 9780079039897…
Algebra
ISBN:
9780079039897
Author:
Carter
Publisher:
McGraw Hill

Trigonometry (MindTap Course List)
Trigonometry
ISBN:
9781337278461
Author:
Ron Larson
Publisher:
Cengage Learning