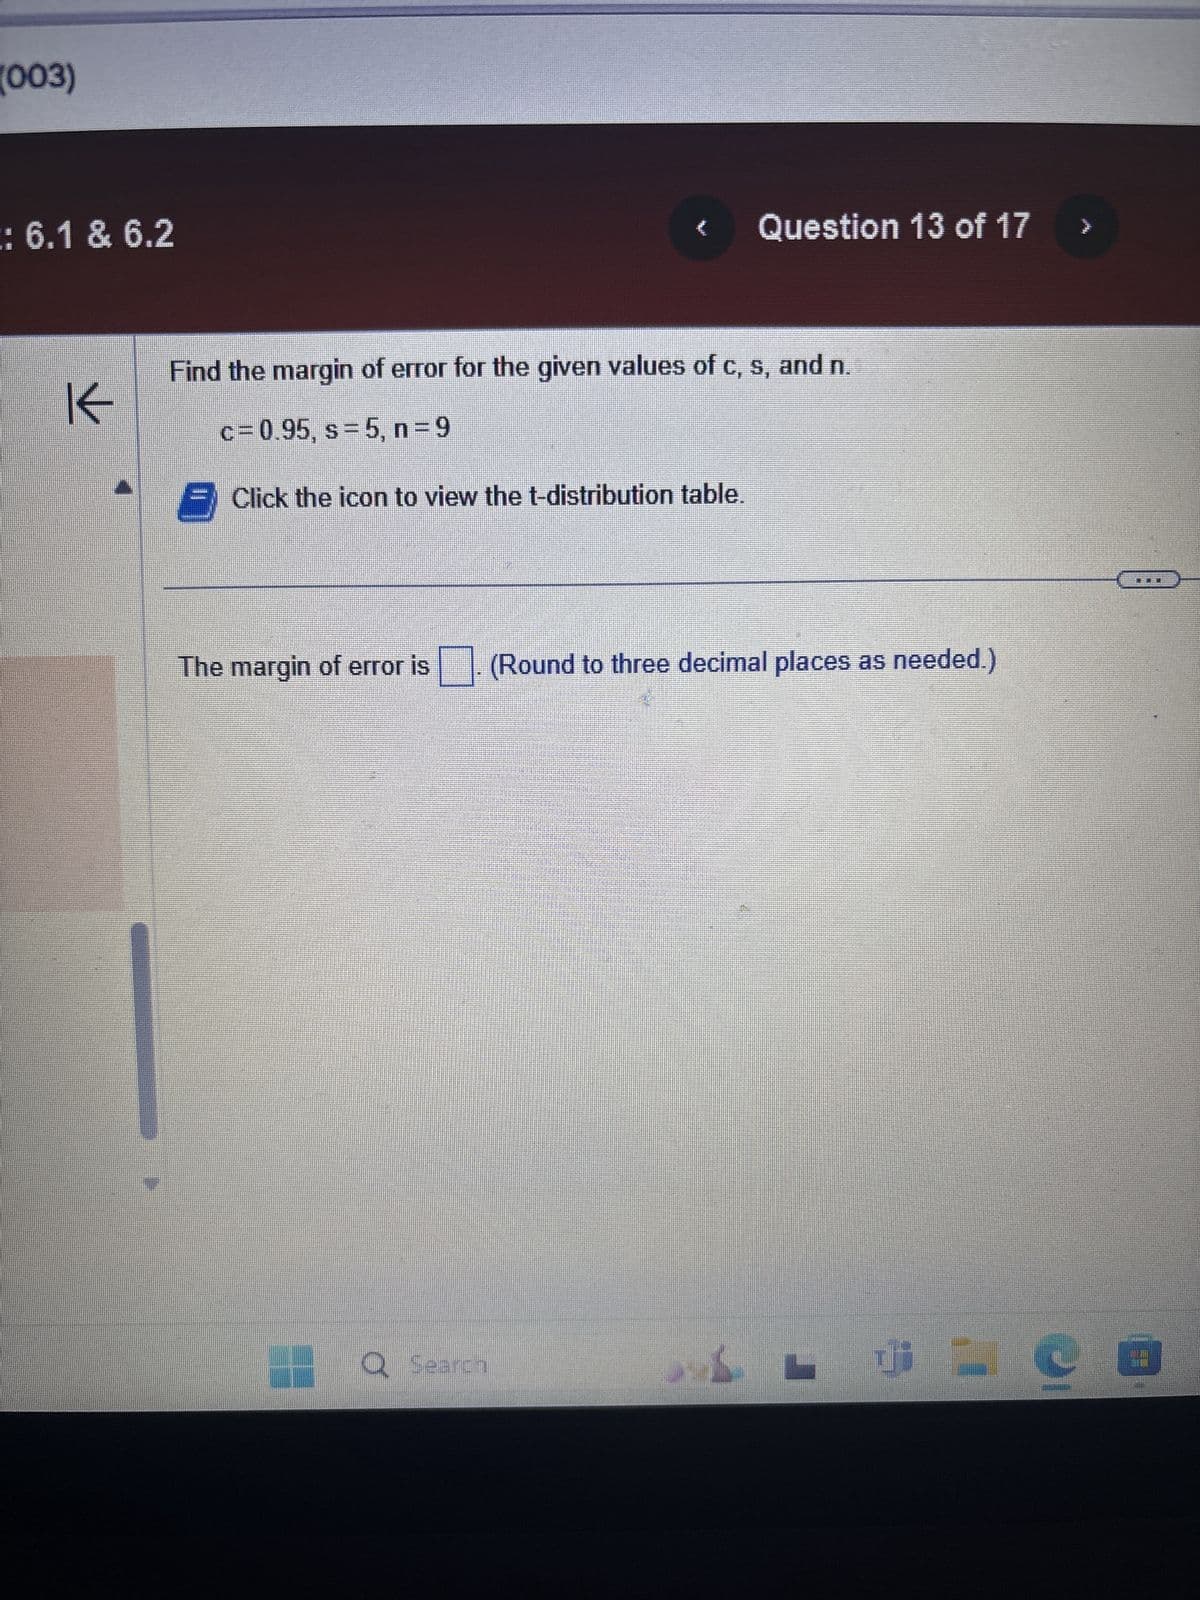
(003) : 6.1 & 6.2 不 Question 13 of 17 Find the margin of error for the given values of c, s, and n. c = 0.95, s = 5, n = 9 Click the icon to view the t-distribution table. The margin of error is (Round to three decimal places as needed.) Q Search


Q: Part 3.2. Find the probability that the customer will have to wait less than 20 minutes or more than…
A: Let X be the random variable the waiting time to be seated for dinner.Given that,
Q: 3 What does the Adjusted R Squared tell us about the relationship between Sales, Price, and…
A: To determine the value of the adjusted r-square and interpret its value.
Q: Vital Statistics for US in one year: k=10,000 Population: 285,318,000 Deaths: 2,416,000 Live Births:…
A: Given the vital statistics.Want to calculate the general fertility rate?The general fertility rate…
Q: here is question 9 being posted
A: The decision rule is reject H0 if the test statistic is less than -1.645 or greater than…
Q: Using the 68-95-99.7 Empirical rule, which of the following z value has an upper tail more than 0.1…
A: Option (a) is correct. Answer: 0.8Explanation:According to the 68-95-99.7 empirical rule about 68%…
Q: Question 4 The time taken by employees at Grace Floral shop to put a bouquet together has a normal…
A: The value of t is approximately 27.07 minutes.Explanation:
Q: Suppose the random variable X follows a binomial distribution with n = 0.50. Using the normal…
A: From the provided information,n = 100 and p = 0.50
Q: Let X be the weights of newborn babies in pounds, and denote m to be its median. For a sample of 14,…
A: π0.25: The first quartile (Q1) is the 25th percentile.π0.35: This percentile is not commonly used,…
Q: This question is meant to showcase boxplot function. Don't assign it! The highway mileage (mpg) for…
A: The data is given as…
Q: Maya recently switched her primary doctor to one specializing in caring for elderly patients. On her…
A: (a) State the null hypothesis H0 and the alternative hypothesis H1Ho: μ = 115H1: μ > 115 (b)…
Q: The following table indicates the unit prices (in Rands) and quantities of three intermediate…
A: To compute the amount, the Paasche price index, and the Laspeyres rate index, we will follow these…
Q: If the mean of a frequency distribution is 100 and the coefficient of variation is 45%, then what is…
A: To find the variance, we need to know the formula for the coefficient of variation (CV) and the…
Q: A random sample of size 49 is taken from a normal population having a mean of 80 and a standard…
A: Let X= The rv that denotes the first normal populationSample size, Mean, Sd, Let Y= The rv that…
Q: W: 6.1 & 6.2 不 L Question 24, 6.2.5 Find the critical value to for the confidence level c=0.80 and…
A: The objective of this question is to find the critical value for a given confidence level and sample…
Q: and 4. (a) If these values represent the numbers of tickets issued by a random sample of 8 state…
A: The question is about inference.Introduction :Population :All set of an individuals or measurements,…
Q: A researcher is testing the effects of plant food on plant growth. Nine plants have been given the…
A: Let be the mean height of plants with plant food and be the mean height of plants without plant…
Q: Categorize these measurements associated with student life according to level: nominal, ordinal,…
A: It is required to identify the level of measurement for the length of time to complete an exam by a…
Q: K In a certain state, it has been shown that only 54% of the high school graduates who are capable…
A: The objective of this question is to find the probability that, among 10 capable high school…
Q: Prove that the slope of the sample regression function (B2) is the blur of the assumption s of gauss…
A: let's try to address your question by considering how the properties of the OLS estimators…
Q: A psychologist is studying the self image of smokers, as measured by the self-image (SI) score from…
A: (a) What are the null hypothesis H0 and the alternative hypothesis H1 that should be used for this…
Q: The heights of 1000 students are approximately normally distributed with a mean of 175.2 centimeters…
A: students' heights have an approximate normal distribution.Mean, cmStandard deviation, cmFrom the…
Q: The assets (in billions of dollars) of the four wealthiest people in a particular country are 39,…
A: Given:The population consists of 40, 29, 17, 10Here the sampling scheme is sampling with…
Q: Which one of the following z values has an upper tail area that is more than 0.5? a) - 2 b) 0…
A: The objective of this question is to identify which of the given z-values has an upper tail area…
Q: population of scores forms a normal distribution with a mean of μ = 75 and a standard eviation of σ…
A: X~N(μ=75, σ=20)
Q: Can you help me solve this using R? 1. Medical research has shown that repeated interval for…
A: The R-Code to computeCompute the mean and standard deviation of wrist extensions.Create a histogram…
Q: Consider the following competing hypotheses and accompanying sample data. (You may find it useful to…
A: The null and alternative hypothesisH0:HA:261n1=355n2=355
Q: K In a certain state, it has been shown that only 54% of the high school graduates who are capable…
A: The objective of this question is to find the probability that, among 10 capable high school…
Q: sample size 20 sample mean 8.3700 sample standard deviation 0.1895 confidence interval…
A: By analyzing the given Excel data, we can determine the p-value for a hypothesis test in which 8.3…
Q: A random experiment involves drawing a sample of 12 data values from a normally distributed…
A: Given dataSample size (n)=12Data : 60, 64, 65, 67,67,71,72,79,80,81,84,87X denotes the random…
Q: a goodness of fit test was run to determine if a sample of data was normally distributd. th…
A: The objective of the question is to determine if the sample data is normally distributed based on…
Q: [In()] y for y 0, 1, 2,... fy 0 y! = otherwise It can be shown that the above probability mass…
A: The objective of the question is to determine which of the given statements related to the…
Q: Provide an appropriate response. Each year advertisers spend billions of dollars purchasing…
A: From the provided information,The data values are as follow:72.7, 63, 57.4, 55.6, 30.7, 25.7, 25.2,…
Q: Find the area under the standard normal distribution curve between 2-0 and 2-0.85. Use The Standard…
A: Here we need to find the area under the standard normal distribution curve between z = 0 and z =…
Q: Determine whether the following statement is true or not. When the observed sample proportion is on…
A: The objective of the question is to determine the validity of the statement that if the observed…
Q: A. The probability P (x27.7) This = B. The probability P (x≥7.7) = This
A: Let be the population's mean hours per day using electronic media.Given that,Population mean…
Q: A high school is running a campaign against the over-use of technology in teens. The committee…
A: sample size(n1)=200sample proportion()=0.85sample size(n2)=180sample proportion()=0.55confidence…
Q: 12:13 ✓ OF W VPN LTE Vo 4G 14 expert.chegg.com + 7 Subject Project 1:Linear Regression LEARNING…
A: The objective of this question is to conduct a linear regression analysis to predict the top speed…
Q: A political candidate has asked you to conduct a poll to determine what percentage of people support…
A: n = 664Explanation:To calculate the sample size needed for a poll with a specific margin of error…
Q: Use 0.95 to denote the value that cuts a lower tail of 0.95 from standard Normal distribution. Use…
A: The objective of the question is to compare the value that cuts a lower tail of 0.95 from a standard…
Q: Mr. Caywood filled out a bracket for the NCAA National Tournament. Based on his knowledge of college…
A: From the provided information,Probability of guessing any one game correctly (p) = 0.53n = 32
Q: i need the answer quickly
A: Seasonal Index is a numerical measure that evaluates how a particular season compares against the…
Q: 1. The proportion of rats that successfully complete a designed experiment (e.g., running through a…
A: Given that are i.i.d Beta random variables with and with the pdf
Q: 8. In how many ways can 12 people be divided into three identical groups of four? 9. In how many…
A: The objective of this question is to find out the number of ways 12 people can be divided into three…
Q: 3. Let X1, Xn 3x2 be a random sample from a population with probability function f(x, 0) = 0 ≤x≤0…
A:
Q: Let X1, . . . , Xn ∼ iid N(0, τ ). Find a pivot V (X, τ ) based on a complete sufficient statistic,…
A: Then, the confidence interval for τ is:[ (n - 1) * S^2 / χ²_u(n-1) , (n - 1) * S^2 / χ²_l(n-1) ]This…
Q: Exercise: Suppose α = 1%. Find Z0.01 and the rejection region. Answer:
A: The level of significance is, .It is needed to find the critical value z0.01.
Q: Suppose a computer chip manufacturer rejects 2% of the chips produced because they fail presale…
A: The probability describes how likely an event occurs.
Q: Construct a normal quantile-quantile plot of the values provided in the accompanying data set, which…
A: The data on the diameters of 36 rivet heads in 1/100 of an inch is given…
Q: The probability that the return will be below X% is approx. 0.16. What is the value of X for Stock…
A: We are given:p = 0.16 (probability of return being below X%)For Stock A and Stock B:X = (1 - p) *…
Q: According to a leasing firm's reports, the mean number of miles driven annually in its leased cars…
A: a) Ho: µ=12680 H1: µ<12680 (claim) b) z-test c) test statistic, z=-2.421 d) p-value=0.0077 e)…

Unlock instant AI solutions
Tap the button
to generate a solution
Click the button to generate
a solution
- only need answers for 1 and 2 Identify the region under the t-distribution corresponding to the t-valueA. P(t10>1.75), where t10 has a t distribution with 10 degrees of freedomQ1A) List down the measures of central tendency and measures of dispersion 1) Q1B) The operations manager of a plant that manufactures tires wants to compare the actual inner diameters of two grades of tires, each of which is expected to be 575 millimeters. A sample of five tires of each grade was selected, and the results representing the inner diameters of the tires, ranked from smallest to largest, are as follows. Grade X grade Y 568 570 575 578 584 573 574 575 577 578 requirement. a) for each of the tow grades of tries, compute the mwan, median, and standred deviation. b) which grade of tire providing better quality? explain. c) what would be the effect on your answer in (a) and (b) if the last value for grade Y were 588 insert 578 explain. PLEAS ANSWER Q1&B. THANK YOU.
- J 1 Consider the hypothesis statement to the right using a=0.01 and the data to the right from two independent samples. A) calcuate the appropriate test statistic and interpret the results b) calculate the p value and interpret the resultsQ1 A) List down the measures of central tendency and measures of dispersion 2) The operations manager of a plant that manufactures tires wants to compare the actual inner diameters of two grades of tires, each of B) which is expected to be 575 millimeters. A sample of five tires of each grade was selected, and the results representing the inner diameters of the tires, ranked from smallest to largest, are as follows. Grade X grade Y 568 570 575 578 584 573 574 575 577 578 requirement. a) for each of the tow grades of tries, compute the mwan, median, and standred deviation. b) which grade of tire providing better quality? explain. c) what would be the effect on your answer in (a) and (b) if the last value for grade Y were 588 insert 578 explain. C) The file contins the overall miles per gallon (MPG) OF 2010 family sedan: 24 21 22 23 24 34 34 34 20 20 22 22 44 32 20 20 22 20 39 20 Source:…The distribution of a large set of temperatures is approxi-mately Normal with a mean of 60° and a standard devia-tion of 5. Estimate the interquartile range for these data. A) 6.7° B) 7.5° C) 10.0°D) 13.4° E) 15.0°
- A meal box enterpreneur wants to know how the meal box size (in centimeters) of parents compares to the meal box size of their children. For a sample of seven parents and their children, the value of the test statistic for the Wilcoxon signed-rank test for a matched pairs sample is T = T+ = 27. The differences are calculated as the parent's meal box size subtracted by the child's meal box size. Specify the competing hypothesis to determine if the median difference in meal box size between parents and children is greater than zero. At the 5% significance level, what is the critical value? At the 5% significance level, what is the decision and conclusion?A horticulture student is interested on the antifungal properties of three plant species. Leaf extracts from each species were mixed with agar based growth medium and poured into 5 Petri dishes. The Petri dishes were streaked with fungi isolates and the area in sq mm of fungal growth was measured after seven days. Assuming the areas of growth are not normally distributed, which is the most appropriate analysis for the experiment to find difference? A. Kruskal Wallis B. Friedman C. t-test D. sign testIn a sample of 300 steel rods, the correlation coefficient between diameter and length was r = 0.15. Find the P-value for testing H0: ρ ≤ 0 vs. H1: ρ > 0. Can you conclude that ρ > 0? Does the result in part (a) allow you to conclude that there is a strong correlation between eccentricity and smoothness? Explain.
- A sample of 56 research cotton samples resulted in asample average percentage elongation of 8.17 and asample standard deviation of 1.42 (“An ApparentRelation Between the Spiral Angle f, the PercentElongation E1, and the Dimensions of the CottonFiber,” Textile Research J., 1978: 407–410). Calculatea 95% large-sample CI for the true average percentageelongation m. What assumptions are you making aboutthe distribution of percentage elongation?Find the right critical value for the F-distribution when a = .05 and DFN = 6 and DFD = 10For a t-curve with df=9, use a t-distribution table to find the t-value t0.025. t0.025=_____________ (Type an integer or a decimal.)