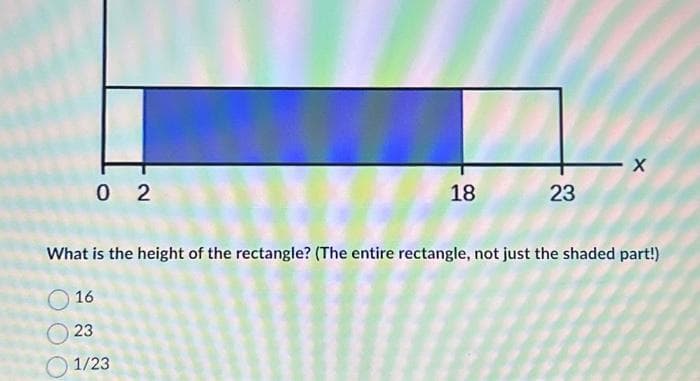
02 16 18 23 1/23 23 What is the height of the rectangle? (The entire rectangle, not just the shaded part!) X


Q: Suppose you wish to estimate a population mean correct to within 0.13 with a confidence level of…
A: We have given that margin of error (E) = 0.13confidence level (c) = 0.90
Q: What is the mean of the distribution? (Again, consider the whole thing, not just the shaded part.…
A: Suppose the continuous random variable of interest is x.
Q: A bottler carefully weighs bottles coming off its production line to check that the system is…
A: From the given information Mean = 814 Standard Deviation = 9Using formula,
Q: (c) Determine if the means of samples 1 and 2 overestimate, underestimate, or are equal to the…
A: From part( a ) and ( b )The population mean pulse is approximately 76.9 beats per minuteThe mean…
Q: The following data are the amounts that a sample of 15 customers spent for lunch ($) at a fast-food…
A: 7.40, 6.29, 5.81, 6.47, 8.28, 9.46, 7.12, 6.83, 5.94, 4.89, 6.52, 5.56, 7.90, 8.28, 9.60We have to…
Q: A national survey asked people, "How often do you eat out for dinner, instead of at home?" The…
A: Relative Frequency = Response FrequencyNever262Rarely458Sometimes926Most of the time250Always 95
Q: The heights (to the nearest inch) of 30 males are shown below. Construct a frequency distribution…
A: The question is about frequency distribution.Given :To find :1 ) Construct a frequency distribution2…
Q: A group of 200 students have been cross classified into the following two way table in terms of…
A: Pierced not Pierced Female7355Male1557
Q: Flexural strength is a measure of a material's ability to resist failure in bending. The…
A: "Since you have posted a question with multiple sub-parts, we will solve the first three sub parts…
Q: The probability distribution of number of televisions per household in a small town A 12 3 015 026…
A: Probability mass function of X is x0123P(X=x)0.020.150.280.55Note: According to bartelby question…
Q: Customers arrive at a local ATM at an average rate of 19 per hour. Assume the time between arrivals…
A: Let customers arrive at a local ATM at an average rate of per hour. Assume the time between…
Q: Suppose a random variable x is best described by a uniform probability distribution with range 2 to…
A: From the provided information,X is best described by a uniform probability distribution with range 2…
Q: The data below shows electricity costs in cents per KWH for a sample of 14 utility companies. The…
A: The given data is as follows:12.4, 12.8, 13.1, 13.6, 13.8, 13.9, 14.0, 14.2, 14.2, 14.4, 14.6, 14.8,…
Q: Automobiles arrive at a vehicle equipment inspection station according to a Poisson process with…
A: Probability is calculated by dividing the total possible events by the total number of events.
Q: 7.55 Surface roughness of pipe. Refer to the Anti-corrosion Methods and Materials (Vol. 50, 2003)…
A: The objective is to validate the claim that if the average surface roughness of the coated interior…
Q: Bivariate data obtained for the paired variables x and y are shown below, in the table labeled…
A:
Q: Here is a data set: Data range Construct a grouped frequency distribution table (GFDT) for this data…
A: The data is given with n=28 values.Data:…
Q: A deck of 52 cards is equally dealt to 4 players. Find the number of ways to distribute the cards so…
A: There are 52 cards in Standard deck. 52 cards are equally dealt to 4 players.The objective is to…
Q: What was the sample size? What percent of participants had a score of 4? of 5? What is the score…
A: Given that,The frequency distribution is,Scoref71867752047332113total129
Q: The following results come from two independent random samples taken of two populations. Sample 1 n₁…
A:
Q: A report gave the accompanying data for the 50 U.S. states on the percentage of the population that…
A: Data : N = 50 (even){…
Q: Use the results of part (c) to compute the coefficient of variation. (Round your answer to the…
A: According to the given information we have to use the results of part (c) to compute coefficient of…
Q: ooking for work (unemployed) in the working age U.S. population. Non-college grads (X=0) College…
A:
Q: (a) P(x≤ a) = 0.8 a = (b) P(x < a) = 0.5 a = (c) P(x ≥ a) = 0.91 a =
A: It is given that a random variable x is best described by a uniform probability distribution with…
Q: From past records, the professor of a large university course has established the following…
A: The distribution of grades received by students in the course is given as…
Q: Coin flip experiment: Use random.uniform() to generate output [Heads, Tail] of a coin flip…
A: Coin flip experiment: Use random.uniform() to generate output [Heads, Tail] of a coin flip…
Q: Fiber content (in grams per serving) for 18 high fiber cereals are shown below. Fiber Content 6 11…
A: The given fiber content (in grams per serving) values are:6, 11, 11, 6, 9, 6, 12, 12, 9, 13, 11, 9,…
Q: You may need to use the appropriate appendix table or technology to answer this question. Minnesota…
A: Note:- "Since you have posted a question with multiple subparts, we will provide solutions only to…
Q: 4) A bakery claims that their muffins weigh, on average, 150 grams. You purchase 12 muffins and…
A: Given that,The sample size is 12. The data is: Muffin Number Weight…
Q: Which of the following statements is TRUE? a.)A high correlation can indicate a relationship but…
A: The objective is to identify the correct statement regrading correlation, which has been interpreted…
Q: G plete parts a. Suppose that the survey had a sample size of n=800. Construct a 95% confidence…
A: The question is about confidence interval.Given :Sample proportion of consumers who value…
Q: Figure 1 shows the relative location map of 100 selected V and U data. V values are above the '+'…
A: “Since you have posted multiple questions, we will provide the solutiononly to the first question as…
Q: In a state OC, there are two parties, Stars and Squares, have their supporters geographically…
A: In district A there are 0 stars and 11 squaresIn district B there are 10 stars and 0 squaresIn…
Q: The state of Connecticut has seatbelt laws for drivers and passengers. It is known that 70% of the…
A: Let Y be the number of drivers who are wearing seatbelts.Given that 70% of the drivers in…
Q: Let Y, represent the ith normal population with unknown mean , and unknown variance of for i= 1,2.…
A: From the above given data the following solution is provided below:
Q: The p-value for a two tailed test with sample size of 21 and test statistic t=1.835 is: a 0.081424 b…
A: Test is two tailed testsample size(n)=21Test statistic(t)=1.835
Q: (1 point) Given the data set below, calculate the range, variance, and standard deviation. range= 49…
A: Range To find the range, subtract the smallest data value from the largest data value:Variance To…
Q: 1 0.8+ 0.6+ 0.4+ 0.2+ 0 0.2 0.4 (a) P(X ≤ 0.3) = (b) P(X= 0.18) = 0.6 0.8 # --- #
A: Let X be a random number between 0 and 1 produced by the idealized uniform random number generator.
Q: At a veterinary emergency room for dogs, cats, and other pets, animals are classified as 15% of them…
A: Let A, B and C be events when an animal is classified as critical, serious and stable respectively.…
Q: What is the area between μ-O and μ + 20? This can also be written as P(μ-o < X < μ+20) where X is a…
A: Suppose the variable of interest is x.
Q: From the stem and leaf plot below, determine the mean, median and mode(s) of the data. Record…
A: From given stem and leaf plot the data set is…
Q: How many beagles weigh between 22.5 lbs and 29.5 lbs?
A: The question is about graphical representation.Introduction :Less than cumulative frequency graph :1…
Q: 2). Imagine that we ask everyone in a class of 20 first year college students how many nights they…
A: List the possible number of nights they socialized: 0, 1, 2, 3, 4, 5, 6, 7.
Q: xercises 1.2.2 e universal set of the following sets. A = {1, 4, 5}, B = {2, 3, 4) and C = {5, 6, 7}…
A: As per the Bartleby guidelines, only the first question with its three subparts can be answered.…
Q: What is the probability of randomly selecting someone whose heart rate either below 60 or above 90?
A: Population mean, = 76Population standard deviation, σ = 5
Q: 10,4 ts a and b. ... 95% confidence interval for the population mean μ. (Round to two decimal places…
A:
Q: (d) P(x > a) = 0.86 a = (e) P(1.62 ≤ x ≤ a) = 0.24 a =
A: It is given that a uniform probability distribution with range 2 to 5.
Q: d. Suppose the standard deviation changes to 108 hours. What are your answers in (a) and (b)? The…
A: The sample size is 81, the sample mean life is 390 hours and the standard deviation is 108 hours.
Q: A card is selected at random from a standard deck of 52 playing cards. Find the probability of each…
A: The experiment is with a standard deck of cards.Total no. of cards in a standard deck = 52It is…
Q: The scatter plot shows the time spent studying, x, and the quiz score, y, for each of 25 students.…
A: Number of students is 25.The scatterplot indicates the time spent studying and the quiz score for…


Trending now
This is a popular solution!

Step by step
Solved in 3 steps
