1 2 3 4 5 6 7 8 9 10 11 12 13 14 15 16 17 18 19 20 21 22 23 24 25 26 27 28 29 30 31 32 33 34 35 36 37 38 39 40 41 42 Initial (°C) (mg/cm2) Treatment 26 26 26 26 26 26 26 26 26 26 26 28 28 28 28 28 28 28 28 28 28 30 30 30 30 30 30 30 30 30 26-30 26-30 26-30 26-30 26-30 26-30 26-30 26-30 26-30 26-30 26-30 552 341 461 430 312 364 468 449 398 394 360 517 428 407 441 472 383 466 345 382 494 573 354 532 393 269 517 469 306 431 306 333 567 379 490 391 509 369 337 365 Final (mg/cm2) 563 352 467 437 320 374 479 460 415 401 369 528 443 415 452 488 391 479 354 393 503 585 369 545 410 277 526 484 322 446 312 378 344 578 392 505 401 523 377 351 373 Change (mg/cm2) 11.000 groups. Be sure the cell range in your equations is correct. • Calculate the standard deviations, samples sizes, and stan- dard errors. Make a graph. Taking into account the standard errors, think about what aspects of the results are believable. 1. What was the mean ± SE (n) coral growth at: 26 °C 28 °C 30 °C 26-30 °C fluctuating daily 2. Remember that the average water temperature of their natu- ral habitat was 28 °C. What would happen if climate change were to cause the average water temperature to increase to 30 °C? If you made a mistake, double check your data entry and the cell range in your equations. Data are often very expensive to gather, so you need to get in the habit of proofreading your data to avoid typos.
1 2 3 4 5 6 7 8 9 10 11 12 13 14 15 16 17 18 19 20 21 22 23 24 25 26 27 28 29 30 31 32 33 34 35 36 37 38 39 40 41 42 Initial (°C) (mg/cm2) Treatment 26 26 26 26 26 26 26 26 26 26 26 28 28 28 28 28 28 28 28 28 28 30 30 30 30 30 30 30 30 30 26-30 26-30 26-30 26-30 26-30 26-30 26-30 26-30 26-30 26-30 26-30 552 341 461 430 312 364 468 449 398 394 360 517 428 407 441 472 383 466 345 382 494 573 354 532 393 269 517 469 306 431 306 333 567 379 490 391 509 369 337 365 Final (mg/cm2) 563 352 467 437 320 374 479 460 415 401 369 528 443 415 452 488 391 479 354 393 503 585 369 545 410 277 526 484 322 446 312 378 344 578 392 505 401 523 377 351 373 Change (mg/cm2) 11.000 groups. Be sure the cell range in your equations is correct. • Calculate the standard deviations, samples sizes, and stan- dard errors. Make a graph. Taking into account the standard errors, think about what aspects of the results are believable. 1. What was the mean ± SE (n) coral growth at: 26 °C 28 °C 30 °C 26-30 °C fluctuating daily 2. Remember that the average water temperature of their natu- ral habitat was 28 °C. What would happen if climate change were to cause the average water temperature to increase to 30 °C? If you made a mistake, double check your data entry and the cell range in your equations. Data are often very expensive to gather, so you need to get in the habit of proofreading your data to avoid typos.

Linear Algebra: A Modern Introduction
4th Edition
ISBN:9781285463247
Author:David Poole
Publisher:David Poole
Chapter3: Matrices
Section3.7: Applications
Problem 44EQ

Related questions
Question
helpppp pleaseeee
Transcribed Image Text:STUDYING 6
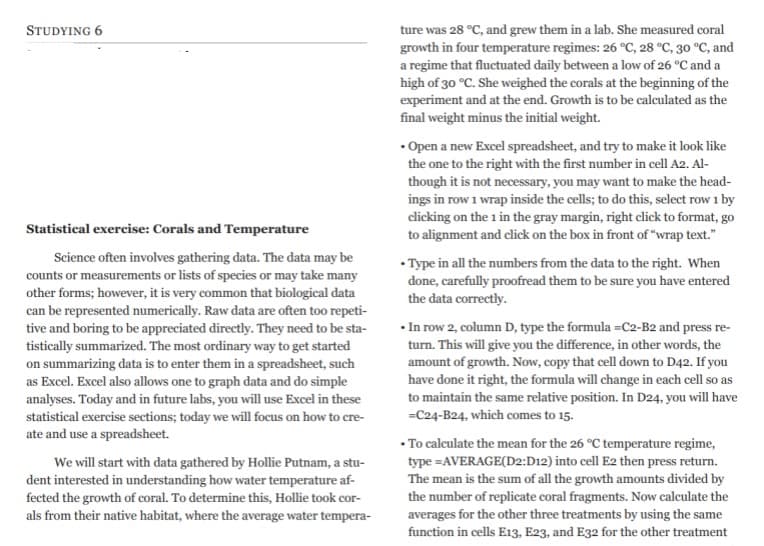
Statistical exercise: Corals and Temperature
Science often involves gathering data. The data may be
counts or measurements or lists of species or may take many
other forms; however, it is very common that biological data
can be represented numerically. Raw data are often too repeti-
tive and boring to be appreciated directly. They need to be sta-
tistically summarized. The most ordinary way to get started
on summarizing data is to enter them in a spreadsheet, such
as Excel. Excel also allows one to graph data and do simple
analyses. Today and in future labs, you will use Excel in these
statistical exercise sections; today we will focus on how to cre-
ate and use a spreadsheet.
We will start with data gathered by Hollie Putnam, a stu-
dent interested in understanding how water temperature af-
fected the growth of coral. To determine this, Hollie took cor-
als from their native habitat, where the average water tempera-
ture was 28 °C, and grew them in a lab. She measured coral
growth in four temperature regimes: 26 °C, 28 °C, 30 °C, and
a regime that fluctuated daily between a low of 26 °C and a
high of 30 °C. She weighed the corals at the beginning of the
experiment and at the end. Growth is to be calculated as the
final weight minus the initial weight.
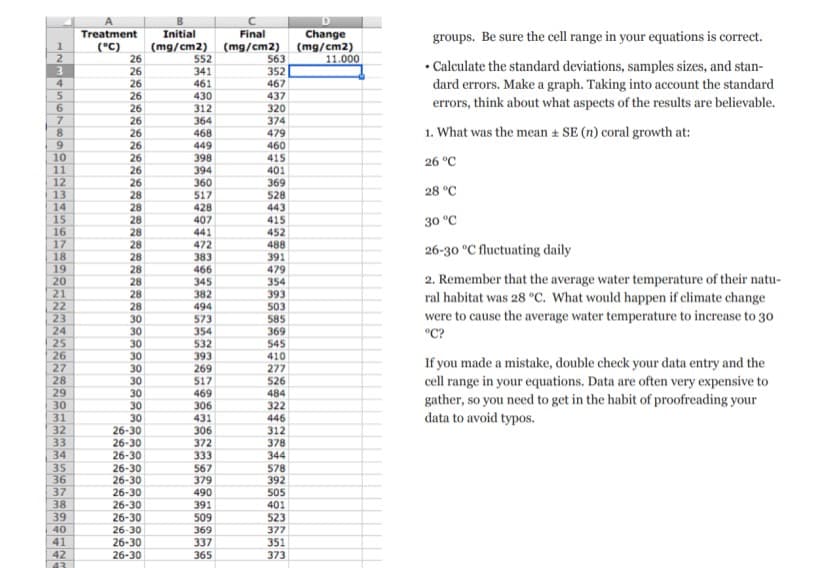
• Open a new Excel spreadsheet, and try to make it look like
the one to the right with the first number in cell A2. Al-
though it is not necessary, you may want to make the head-
ings in row 1 wrap inside the cells; to do this, select row 1 by
clicking on the 1 in the gray margin, right click to format, go
to alignment and click on the box in front of "wrap text."
• Type in all the numbers from the data to the right. When
done, carefully proofread them to be sure you have entered
the data correctly.
•In row 2, column D, type the formula =C2-B2 and press re-
turn. This will give you the difference, in other words, the
amount of growth. Now, copy that cell down to D42. If you
have done it right, the formula will change in each cell so as
to maintain the same relative position. In D24, you will have
=C24-B24, which comes to 15.
• To calculate the mean for the 26 °C temperature regime,
type =AVERAGE(D2:D12) into cell E2 then press return.
The mean is the sum of all the growth amounts divided by
the number of replicate coral fragments. Now calculate the
averages for the other three treatments by using the same
function in cells E13, E23, and E32 for the other treatment
Transcribed Image Text:1
2
3
4
5
6
7
8
9
10
11
12
13
14
15
16
17
18
19
20
21
22
23
24
25
26
27
28
29
30
31
32
33
34
35
36
37
38
39
40
41
42
43
A
Treatment
Initial
(°C) (mg/cm2)
26
26
26
26
26
26
26
26
26
26
26
28
28
28
28
28
28
28
28
28
28
30
30
30
30
30
30
30
30
30
26-30
26-30
26-30
26-30
26-30
26-30
26-30
26-30
26-30
26-30
26-30
552
341
461
430
312
364
468
449
398
394
360
517
428
407
441
472
383
466
345
382
494
573
354
532
393
269
517
469
306
431
306
372
333
567
379
490
391
509
369
337
365
Final
(mg/cm2)
563
352
467
437
320
374
479
460
415
401
369
528
443
415
452
488
391
479
354
393
503
585
369
545
410
277
526
484
322
446
312
378
344
578
392
505
401
523
377
351
373
D
Change
(mg/cm2)
11.000
groups. Be sure the cell range in your equations is correct.
• Calculate the standard deviations, samples sizes, and stan-
dard errors. Make a graph. Taking into account the standard
errors, think about what aspects of the results are believable.
1. What was the mean ± SE (n) coral growth at:
26 °C
28 °C
30 °C
26-30 °C fluctuating daily
2. Remember that the average water temperature of their natu-
ral habitat was 28 °C. What would happen if climate change
were to cause the average water temperature to increase to 30
°C?
If you made a mistake, double check your data entry and the
cell range in your equations. Data are often very expensive to
gather, so you need to get in the habit of proofreading your
data to avoid typos.
Expert Solution
This question has been solved!
Explore an expertly crafted, step-by-step solution for a thorough understanding of key concepts.

Step by step
Solved in 5 steps

Recommended textbooks for you
Linear Algebra: A Modern Introduction
Algebra
ISBN:
9781285463247
Author:
David Poole
Publisher:
Cengage Learning

Functions and Change: A Modeling Approach to Coll…
Algebra
ISBN:
9781337111348
Author:
Bruce Crauder, Benny Evans, Alan Noell
Publisher:
Cengage Learning

Algebra & Trigonometry with Analytic Geometry
Algebra
ISBN:
9781133382119
Author:
Swokowski
Publisher:
Cengage
Linear Algebra: A Modern Introduction
Algebra
ISBN:
9781285463247
Author:
David Poole
Publisher:
Cengage Learning
Functions and Change: A Modeling Approach to Coll…
Algebra
ISBN:
9781337111348
Author:
Bruce Crauder, Benny Evans, Alan Noell
Publisher:
Cengage Learning
Algebra & Trigonometry with Analytic Geometry
Algebra
ISBN:
9781133382119
Author:
Swokowski
Publisher:
Cengage

Big Ideas Math A Bridge To Success Algebra 1: Stu…
Algebra
ISBN:
9781680331141
Author:
HOUGHTON MIFFLIN HARCOURT
Publisher:
Houghton Mifflin Harcourt