1 2 3 4 5 6 7 8 9 10 11 12 13 14 15 16 17 18 19 20 21 22 23 24 25 26 27 28 29 30 31 32 33 34 35 36 37 38 39 40 41 42 43 44 45 46 C2 RUN 38.23 37.10 40.07 38.28 40.83 43.62 38.27 41.75 38.77 37.13 37.12 45.32 42.77 43.58 32.97 33.23 32.57 32.18 32.00 34.60 33.65 33.32 34.52 33.30 37.18 36.55 34.42 37.78 36.53 32.95 36.70 35.13 31.42 36.37 36.38 36.92 33.37 37.18 35.25 C1 C2 START NUM>> RUN 49 36.40 51 35.52 53 35.15 55 31.35 57 36.03 59 34.43 73 36.22 C1 START NUM>> 1 2 3 4 5 6 7 8 9 10 12 14 16 18 20 21 22 23 24 25 26 27 28 29 30 31 32 33 34 35 36 37 38 39 40 41 43 45 47 TH C3 P T1 0.68 0.73 0.75 0.85 0.90 1.15 0.83 1.02 0.83 0.72 0.58 0.78 0.55 0.82 0.52 0.65 0.67 0.57 0.62 0.73 0.80 0.60 0.83 0.70 1.00 0.83 0.88 0.68 0.65 0.75 0.95 0.82 0.78 0.82 0.82 0.65 0.72 0.83 0.75 C3 T1 0.75 0.60 0.73 0.65 0.72 1.02 0.78 C4 CYCLE 34.52 35.60 37.53 34.72 36.63 38.70 34.75 36.52 34.25 36.40 35.33 42.58 40.28 35.90 26.87 28.65 27.10 27.87 28.68 27.77 30.78 28.60 28.15 29.62 28.38 33.55 27.78 30.17 31.20 31.95 32.63 29.67 29.85 31.22 32.30 32.58 30.83 27.12 29.22 C4 CYCLE 34.57 30.52 33.10 31.15 27.58 38.28 30.13 C5 T2 1.03 1.05 1.33 1,25 1.88 1.48 1.47 1.23 1.40 0.95 0.90 1.37 1.18 0.93 0.62 0.73 1.08 0.85 0.92 0.95 1.22 0.83 1.03 1.02 1.87 1.73 1.37 1.37 0.98 1.50 1,23 1.27 1.08 1.10 1.48 0.97 0.92 1.17 0.98 C6 C7 C8 SKI TOTAL ELITE 30.15 104.61 Y 32.30 106.78 Y 31.32 111.00 Y 30.30 105.40 Y 31.98 112,22 Y 32.68 117.63 31.22 106.54 33.17 113.69 33.70 108.95 30.63 105.83 27.00 100.93 36.92 126.97 34.52 119.30 30.52 111,75 23.78 84.76 25.35 88.61 24.82 86.24 24.08 85.55 24.52 86.74 26.42 90.47 26.78 93.23 24.83 88.18 25.77 90.30 23.75 88.39 27.48 95.91 31.12 103.78 28.15 92.60 30.38 100.38 26.95 96.31 30.05 97.20 26.98 98.49 26.48 93.37 23.45 86.58 30.37 99.88 37.33 108.31 27.83 98.95 26.88 92.72 25.92 92.22 25.92 92.12 Elite.mwx C5 T2 1.03 0.85 0.88 0.93 1.37 1.23 1.30 Y Y Y Y Y Y Y Y Y Y Y Y Y Y Y Y Y Y Y Y Y Y Y Y Y Y Y Y Y Y Y Y Y Y C6 C7 C8 SKI TOTAL ELITE 27.02 99.77 Y 27.48 94.97 Y 26.10 95.96 Y 25.33 89.41 Y 28.17 93.87 Y 29.07 104.03 Y 27.67 96.10 Y C9 HOME A A A A A A H A H A A A A A A A A A H H A A A A A A A A A A A A A H A A A H A C9 HOME A A A H A A A C10 CLASS Elite Elite Elite Elite Elite Elite Elite Elite Elite Elite Elite Elite Elite Elite Elite Elite Elite Elite Elite Elite Elite Elite Elite Elite Elite Elite Elite Elite Elite Elite Elite Elite Elite Elite Elite Elite Elite Elite Elite T C10 CLASS Elite Elite Elite Elite Elite Elite Elite
1 2 3 4 5 6 7 8 9 10 11 12 13 14 15 16 17 18 19 20 21 22 23 24 25 26 27 28 29 30 31 32 33 34 35 36 37 38 39 40 41 42 43 44 45 46 C2 RUN 38.23 37.10 40.07 38.28 40.83 43.62 38.27 41.75 38.77 37.13 37.12 45.32 42.77 43.58 32.97 33.23 32.57 32.18 32.00 34.60 33.65 33.32 34.52 33.30 37.18 36.55 34.42 37.78 36.53 32.95 36.70 35.13 31.42 36.37 36.38 36.92 33.37 37.18 35.25 C1 C2 START NUM>> RUN 49 36.40 51 35.52 53 35.15 55 31.35 57 36.03 59 34.43 73 36.22 C1 START NUM>> 1 2 3 4 5 6 7 8 9 10 12 14 16 18 20 21 22 23 24 25 26 27 28 29 30 31 32 33 34 35 36 37 38 39 40 41 43 45 47 TH C3 P T1 0.68 0.73 0.75 0.85 0.90 1.15 0.83 1.02 0.83 0.72 0.58 0.78 0.55 0.82 0.52 0.65 0.67 0.57 0.62 0.73 0.80 0.60 0.83 0.70 1.00 0.83 0.88 0.68 0.65 0.75 0.95 0.82 0.78 0.82 0.82 0.65 0.72 0.83 0.75 C3 T1 0.75 0.60 0.73 0.65 0.72 1.02 0.78 C4 CYCLE 34.52 35.60 37.53 34.72 36.63 38.70 34.75 36.52 34.25 36.40 35.33 42.58 40.28 35.90 26.87 28.65 27.10 27.87 28.68 27.77 30.78 28.60 28.15 29.62 28.38 33.55 27.78 30.17 31.20 31.95 32.63 29.67 29.85 31.22 32.30 32.58 30.83 27.12 29.22 C4 CYCLE 34.57 30.52 33.10 31.15 27.58 38.28 30.13 C5 T2 1.03 1.05 1.33 1,25 1.88 1.48 1.47 1.23 1.40 0.95 0.90 1.37 1.18 0.93 0.62 0.73 1.08 0.85 0.92 0.95 1.22 0.83 1.03 1.02 1.87 1.73 1.37 1.37 0.98 1.50 1,23 1.27 1.08 1.10 1.48 0.97 0.92 1.17 0.98 C6 C7 C8 SKI TOTAL ELITE 30.15 104.61 Y 32.30 106.78 Y 31.32 111.00 Y 30.30 105.40 Y 31.98 112,22 Y 32.68 117.63 31.22 106.54 33.17 113.69 33.70 108.95 30.63 105.83 27.00 100.93 36.92 126.97 34.52 119.30 30.52 111,75 23.78 84.76 25.35 88.61 24.82 86.24 24.08 85.55 24.52 86.74 26.42 90.47 26.78 93.23 24.83 88.18 25.77 90.30 23.75 88.39 27.48 95.91 31.12 103.78 28.15 92.60 30.38 100.38 26.95 96.31 30.05 97.20 26.98 98.49 26.48 93.37 23.45 86.58 30.37 99.88 37.33 108.31 27.83 98.95 26.88 92.72 25.92 92.22 25.92 92.12 Elite.mwx C5 T2 1.03 0.85 0.88 0.93 1.37 1.23 1.30 Y Y Y Y Y Y Y Y Y Y Y Y Y Y Y Y Y Y Y Y Y Y Y Y Y Y Y Y Y Y Y Y Y Y C6 C7 C8 SKI TOTAL ELITE 27.02 99.77 Y 27.48 94.97 Y 26.10 95.96 Y 25.33 89.41 Y 28.17 93.87 Y 29.07 104.03 Y 27.67 96.10 Y C9 HOME A A A A A A H A H A A A A A A A A A H H A A A A A A A A A A A A A H A A A H A C9 HOME A A A H A A A C10 CLASS Elite Elite Elite Elite Elite Elite Elite Elite Elite Elite Elite Elite Elite Elite Elite Elite Elite Elite Elite Elite Elite Elite Elite Elite Elite Elite Elite Elite Elite Elite Elite Elite Elite Elite Elite Elite Elite Elite Elite T C10 CLASS Elite Elite Elite Elite Elite Elite Elite

Chapter8: Sequences, Series,and Probability
Section8.7: Probability
Problem 4ECP: Show that the probability of drawing a club at random from a standard deck of 52 playing cards is...

Related questions
Question
100%
Transcribed Image Text:1
2
3
4
5
6
7
8
9
10
11
12
13
14
15
16
17
18
19
20
21
22
23
24
25
26
27
28
29
30
31
32
33
34
35
36
37
38
39
40
41
42
43
44
45
46
C1
START NUM>>
1
2
3
4
5
6
7
8
9
10
12
14
16
18
20
21
22
23
24
25
26
27
28
29
30
31
32
33
34
35
36
37
38
39
40
41
43
45
47
C1
START NUM>>
49
51
53
55
57
59
73
C2
RUN
38.23
37.10
40.07
38.28
40.83
43.62
38,27
41.75
38.77
37.13
37.12
45.32
42.77
43.58
32.97
33.23
32.57
32.18
32.00
34.60
33.65
33.32
34.52
33.30
37.18
36.55
34.42
37.78
36.53
32.95
36.70
35.13
31.42
36.37
36.38
36.92
33.37
37.18
35.25
Udle
C2
RUN
36.40
35.52
35.15
31.35
36.03
34.43
36.22
TH+
+++
C3
T1
0.68
0.73
0.75
0.85
0.90
1.15
0.83
1.02
0.83
0.72
0.58
0.78
0.55
0.82
0.52
0.65
0.67
0.57
0.62
0.73
0.80
0.60
0.83
0.70
1.00
0.83
0.88
0.68
0.65
0.75
0.95
0.82
0.78
0.82
0.82
0.65
0.72
0.83
0.75
C3
T1
0.75
0.60
0.73
0.65
0.72
1.02
0.78
C4
CYCLE
34.52
35.60
37.53
34.72
36.63
38.70
34.75
36.52
34.25
36.40
35.33
42.58
40.28
35.90
26.87
28.65
27.10
27.87
28.68
27.77
30.78
28.60
28.15
29.62
28.38
33.55
27.78
30.17
31.20
31.95
32.63
29.67
29.85
31.22
32.30
32.58
30.83
27.12
29.22
H
C4
CYCLE
34.57
30.52
33.10
31.15
27.58
38,28
30.13
1.
Elite.mwx
C5
T2
1.03
1.05
1.33
1.25
1.88
1.48
1.47
1.23
1.40
0.95
0.90
1.37
1.18
0.93
0.62
0.73
1.08
0.85
0.92
0.95
1.22
0.83
1.03
1.02
1.87
1.73
1.37
1.37
0.98
1.50
1.23
1.27
1.08
1.10
1.48
0.97
0.92
1.17
0.98
++
C6
C7
SKI
TOTAL
30.15
104.61
32.30
106.78
31.32
111.00
30.30
105.40
31.98
112,22
32.68
117.63
31.22 106.54
33.17
113.69
33.70
108.95
30.63 105.83
27.00
100.93
36.92 126.97
34.52
119.30
30.52
111.75
23.78
84.76
25.35
88.61
24.82
86.24
24.08 85.55
24.52
86.74
26.42
90.47
26.78
93.23
24.83
88.18
25.77
90.30
23.75
88.39
27.48
95.91
31.12
103.78
28.15
92.60
30.38
100.38
26.95
96.31
30.05 97.20
26.98
98.49
26.48
93.37
23.45
86.58
30.37 99.88
37.33
108.31
27.83
98.95
26.88
92.72
25.92
92.22
25.92
92.12
Elite.mwx
C5
T2
1.03
0.85
0.88
0.93
1.37
1.23
1.30
++
C6
SKI
27.02
27.48
26.10
25.33
28.17
29.07
27.67
+
C8
ELITE
Y
Y
Y
Y
Y
Y
Y
Y
Y
Y
Y
Y
Y
Y
Y
Y
Y
Y
Y
Y
Y
Y
Y
Y
Y
Y
Y
Y
Y
Y
Y
Y
Y
Y
Y
Y
Y
Y
Y
C7
C8
TOTAL ELITE
99.77
Y
94.97
Y
95.96
Y
89.41
Y
93.87
Y
104.03
Y
96.10
Y
C9
HOME
A
A
A
A
A
A
H
A
H
A
A
A
A
A
A
A
A
A
H
H
A
A
A
A
A
A
A
A
A
A
A
A
A
H
A
A
A
H
A
C9
HOME
A
A
A
H
A
A
4
A
C10
CLASS
Elite
Elite
Elite
Elite
Elite
Elite
Elite
Elite
Elite
Elite
Elite
Elite
Elite
Elite
Elite
Elite
Elite
Elite
Elite
Elite
Elite
Elite
Elite
Elite
Elite
Elite
Elite
Elite
Elite
Elite
Elite
Elite
Elite
Elite
Elite
Elite
Elite
Elite
Elite
C10
CLASS
Elite
Elite
Elite
Elite
Elite
Elite
Elite
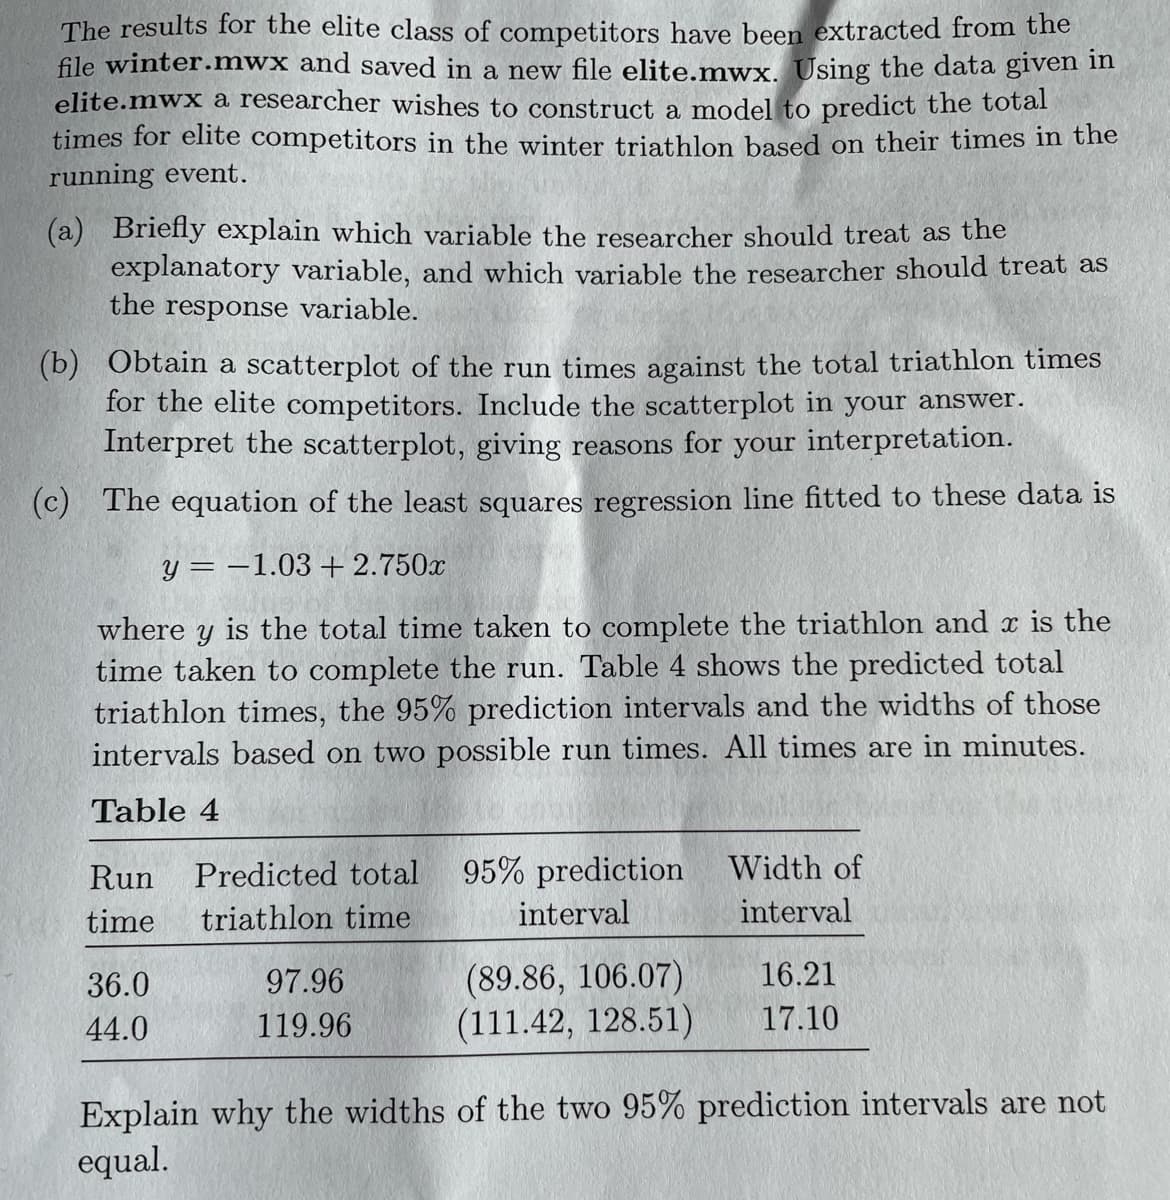
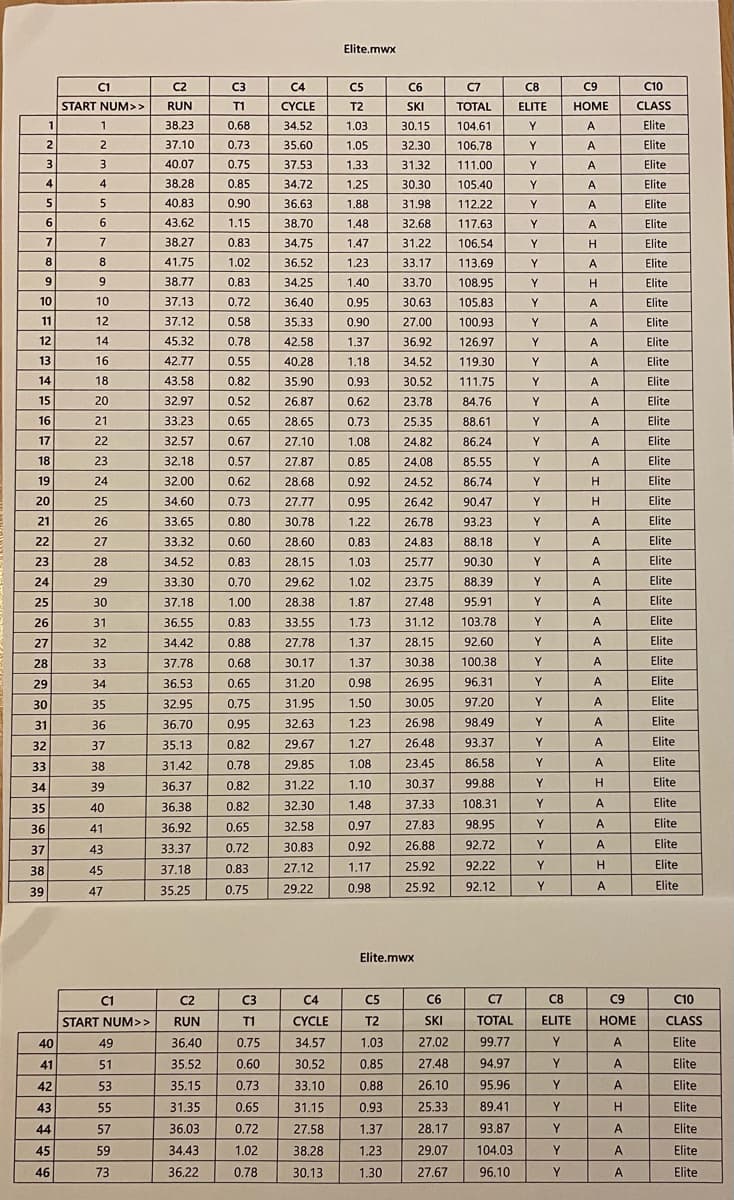
Transcribed Image Text:The results for the elite class of competitors have been extracted from the
file winter.mwx and saved in a new file elite.mwx. Using the data given in
elite.mwx a researcher wishes to construct a model to predict the total
times for elite competitors in the winter triathlon based on their times in the
running event.
(a) Briefly explain which variable the researcher should treat as the
explanatory variable, and which variable the researcher should treat as
the response variable.
(b) Obtain a scatterplot of the run times against the total triathlon times
for the elite competitors. Include the scatterplot in your answer.
Interpret the scatterplot, giving reasons for your interpretation.
(c) The equation of the least squares regression line fitted to these data is
y = -1.03 +2.750x
where y is the total time taken to complete the triathlon and x is the
time taken to complete the run. Table 4 shows the predicted total
triathlon times, the 95% prediction intervals and the widths of those
intervals based on two possible run times. All times are in minutes.
Table 4
Run Predicted total
95% prediction
Width of
time
triathlon time
interval
interval
36.0
97.96
(89.86, 106.07)
16.21
44.0
119.96
(111.42, 128.51)
17.10
Explain why the widths of the two 95% prediction intervals are not
equal.
Expert Solution
This question has been solved!
Explore an expertly crafted, step-by-step solution for a thorough understanding of key concepts.

Step by step
Solved in 4 steps with 2 images

Recommended textbooks for you

Algebra & Trigonometry with Analytic Geometry
Algebra
ISBN:
9781133382119
Author:
Swokowski
Publisher:
Cengage
Algebra & Trigonometry with Analytic Geometry
Algebra
ISBN:
9781133382119
Author:
Swokowski
Publisher:
Cengage