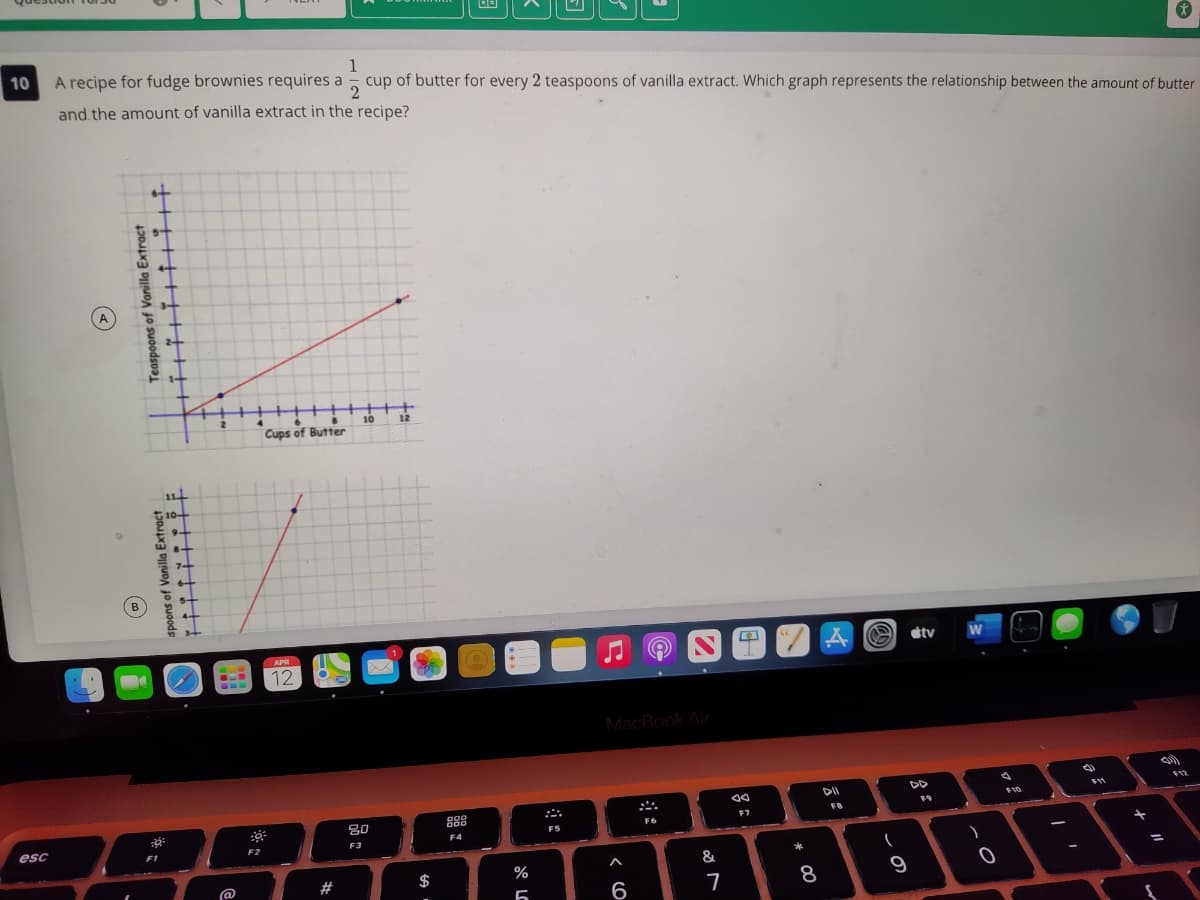
1 A recipe for fudge brownies requires a cup of butter for every 2 teaspoons of vanilla extract. Which graph represents the relationship between the amount of butter and the amount of vanilla extract in the recipe?
Q: Examine each graph below. Based on the shape of the graph and the labels on the axes, write a…
A:
Q: An ice-cream store manager is considering adding a new flavor. The bar graph shows the best-selling…
A: Given graph of best selling ice cream flavours. We need to find the flavour wich can be added…
Q: Question: Which graph represents y = 3x - 1
A: Given equation , y = 3x - 1
Q: When visiting his parents, Tyler drives at an average speed of 42 km/h through urban areas and at an…
A:
Q: A recipe for fudge brownies 1 requires a cup of butter for 2 every 2 teaspoons of vanilla extract.…
A: Let x shows cup of butter Let Y shows teaspoons of vanilla extract
Q: 17. Scott's Heating and Air Conditioning charges $80.00 for a service call and $30.00 for each hour…
A: →Dear learner, As per our guideline,I can solve only one question at once.Further can be…
Q: 19. The graph shows the relationship between the number of hours h Greg has been driving and the…
A: Find the speed of greg from the given conditions
Q: Which equation represents the graph shown below? 14 12 10 -40 40 80 120 160 200 240 360 280 320 -8…
A:
Q: The graph to the right uses cylinders to represent barrels of oil consumed by two countries. Does…
A: The graph uses cylinder to represent barrels of oil consumption. The provided cylindrical shape…
Q: the graph represents part of Brooke’s trip to work. During what time period is her speed decreasing…
A: Given , The graph represents part of Brooke’s trip to work. We have to find time period where her…
Q: Question: Which graph represents y = -2x + 2
A: The given function is: y=-2x+2
Q: 8. The graph shows the amount of money that Janic saves each week from her summer job. Which…
A:
Q: 1. Frank and his family drove 6 hours every day during a road trip. Which graph best represents y,…
A: From the given information, the number of hours driven in first day is 6 and the number of hours…
Q: Question: Which graph represents y = -2x + 6
A:
Q: -20어 10 (18, 2) -10 10 20 30 -10-
A:
Q: Determine xmin, xmax, ymin, ymax and the scales for each axis from the following graph. 40-
A: The given graph is as follows:
Q: Question: Which graph represents (y = 1 / 2x - 1)
A:
Q: The graph shows the relationship between the total cost of peaches and the number of pounds of…
A: The given graph is: The total cost of peaches is depending upon the number of pounds peaches.
Q: A recipe for pizza bases requires 1 1/2 teaspoons of sugar for every 1 cup of water. Which graph…
A: Given 1 1/2 teaspoons of sugar for every 1 cup of water.
Q: 4.) Samantha types an average of 50 words per minute. Which of the following graphs shows the…
A: Given that the Samantha types an average of 50 words per minute. To determine the correct graph that…
Q: How do you sketch the following graph?
A:
Q: 17. Scott's Heating and Air Conditioning charges $80.00 for a service call and $30.00 for each hour…
A: Given that charge for a service call is $80.00 and $30.00 for each hour of work. So fixed cost is…
Q: Which equation represents the graph below? WEST
A: We have to determine the equation of the given graph. For this, we have to find the roots of the…
Q: 2.) Which graph is the daily case for New York? a. I b. II c. III d. IV
A: Please see the below picture for detailed solution.
Q: 5. The graph shows the relationship between Albany's temperature and Sydney's temperature. If…
A: Try to pick some coordinates obviously that would not be 100% correct but that will help in finding…
Q: 6. If Arthur had spent less time reading his newspaper, which part of the graph would change? How…
A: If author had spent less time reading newspaper
Q: Using the graph how many adults do not carpool to work
A: The bar graph of method of transportation corresponding to number of adults is given.
Q: The graph shows the number of deaths in the United States due to accidents. Answer the following…
A: Given graph shows the number of deaths in the US due to accidents.
Q: Lee runs 5 miles per day. Which of the following graphs represents the total number of miles he…
A:
Q: Junior is saving money in his piggy bank. He starts with 10 cents and adds 2 every day. Draw a graph…
A: Junior is saving money in his piggy bank.He starts with 10 cent and added 2 everyday.so,the initial…
Q: The line graph shows the number of new passengers who boarded a bus when it made 8 stops along its…
A:
Q: The graph below is the shoe sizes and heights (in inches) of 14 men. Determine the strength of the…
A: In a Scatter plot, if x variable increases as the y variable increases, it depicts a positive…
Q: Which pair of graphs are equivalent? A. В. C. D. D
A: To find which pair of graphs are equivalent: Equivalent graphs: Two graphs are equivalent if…
Q: The coaches of a group of debate teams answered a survey about hours of debate team practice and…
A: Given:
Q: 30 25 20 > 15 10 0 2 4 6 8 10 Complete the equation for the graph:
A:
Q: The following is what type of graph? Sales Competition Results 14 12 10 Jeri Jacob Ella Eli…
A: Bar Graph A bar graph is a graph represented by spaced rectangular bars that describe the data…
Q: A Christmas traveling at 65 miles per hour on the interstate. Where graph shows the relationship…
A: Given the graph shows the relationship between the time spent in travelling in hours and the total…
Q: Graph the following explanation on the graph S = 25N
A:
Q: Janice has a pasta recipe that calls for 2 oz. of cheese for every 3 oz. of cooked pasta. Find the…
A:
Q: What is the mode in the graph below? 600- 500- 400- 300 200- Frequency
A: Given data,here frequency distribution graph is given .we have find out the mode of the graph here…
Q: graphs represent the situations and why
A: a. Option II will be the answer to option a. Reason: The normal distribution is a type of…
Q: Which graph is the right answer
A: Given Profit function This is the equation of parabola
Q: The graph to the right shows the number of snow shovels sold in winter months at a store in 2010 and…
A: Proceed as shown below
Q: 6. Keisha is taking a road trip to her grandmother's house. She drives the first 225 miles in 3…
A:
Q: 3. Draw the graph using the tables and Find the linear or non-linear; and the relationship X Y 7 12…
A:
Q: Cell Phone Bill 90 80 70 60 50 40 30 20 10 2 6. 8. 10 12 14 16 18 20 Time Worked (Hours) Where is…
A: STEPS 1. FIND SLOPE OF LINE 2.WRITE THE EQUATION OF LINE IN GENERAL FORM ' Y= mX+C ' where m =…
Q: 6. Determine an equation for each graph.
A: a) If you can observe, notice that the nature is like a cosec function. It is just shifted towards…
Q: What relationship does the graph represent? 4 A. Strong Negative 3.5 B. Strong Positive 3 C. Weak…
A: Correlations are used to measure the strength of association between the two numerical variable.…
Q: A new computer loses of its value every year. Which graph could represent the 6. relationship…
A: Given that, The cost of new computer decreases 2/6 (1/3) of its value every year. The value of…
Q: Vinny collects population data, P(h), about a specific strain of bacteria over time in hours, h, as…
A: To check the graph , we put the points from the graph to the equation given in options.
Trending now
This is a popular solution!
Step by step
Solved in 2 steps with 2 images
- Sarah wants to use orders last 60 customers to create a circle graph comparing the number of people ordering each type of salad to the total number of people ordering salads. Twelve customers ordered chef salads, six ordered Caesar salads, 18 ordered taco salads, 15 ordered spinach salads, and nine ordered garden salads. She will need to percentages to draw the graph. Complete the table below and show work: Salads Percent Chef Caesar Taco Spinach GardenThere is a percentage of canadians who have been voting for Canadian elections every 4 yrs since 1800,george wants to compare the percentage of people who have voted in 1848 to the percentage of people who have voted in 2000.which type of graph should he use 1 bar graph 2 pie chart 3 histogram 4 line chartWhich scatterplot shows the strongest and weakest relationship
- A group of students plotted the number of hours they worked at a cake shop during the holidays and the number of cakes they delivered in a week.Which statement best describes the relationship between the number of hours spent working at the cake shop and the number of cakes delivered? Greater hours worked, more cakes delivered Fewer hours worked, more cakes delivered Greater hours worked, fewer cakes delivered There is no relationship between hours spent working and number of cakes delivered.Lárus, a chemist, was investigating whether there was a relationship between the amount of antibody in the blood and the weight of individuals. To do this, he measured the amount of antibody in the blood and the weight of 50 individuals. What graph should he use to graphically examine the possible relationship between the variables? a) Bar chartb) Punctuationc)Coefficientsd) Cashiere) Cake chartWhat type of graph would you use to depict the relationship between: Is the number of days in the Intensive Care Unit(ICU LOS) related to gender? If ICU LOS were two different variables and one was coded as categorical and the other as continuous, would you use the same graph to depict the relationship between the variables? For example: 1. # of days in ICU(as a continuous variable) and gender.. 2. # of days in ICU(as a categorical variable) and gender. Would you use the same graph for numbers 1 and 2? Which graphs would you choose?
- The scatterplot below shows the percent of families who own their home vs. the percent of the population living in urban areas. There are 52 observations, each corresponding to a state in the US. Puerto Rico and District of Columbia are also included. (a) Describe the relationship between the percent of families who own their home and the percent of the population living in urban areas. (b) The outlier at the bottom right corner is District of Columbia, where 100% of the population is considered urban. What type of an outlier is this observation?Andrea conducted a survey in which she collected data on the percentage of people who like horror films and the percentage of people who like romantic dramas. Which of the following could sufficiently display the data if only the two given categories are to be included? Pie Chart Bar Graph Neither pie chart or bar graph Either a pie chart or bar graph(2) How many people are presented on this graph? (1pts) (3) How many people have a cholesterol level between 56 and 70? (4) What percent of people have a cholesterol level less the 49? (5) What percent of people have a cholesterol level between 35 and 56?
- The coaches of a group of debate teams answered a survey about hours of debate team practice and number of team wins. The graph shows the results of this survey. Based on these results, if a team practices 4 hours per week next season, which is the best estimate of the number of debates the team can expect to win? 1 12 16 20Alice has accumulated $260,557 in savings and wishes to invest this money sensibly. The types of investments and their corresponding percentages, recommended by a financial advisor, are shown in the following circle graph. Recommended Categories of Investment: stocks 13.73% mutual funds 51% real estate 10% annuities10% bonds 15.27% Find the amount of money that Alice should invest in stocks, mutual funds, real estate, annuities, and bonds. Round your answer to the nearest hundredth, if necessary.Jolie manages an annual film festival in her town. Every year, one movie from every genre is chosen as a finalist to win best film. The following double bar graph represents the votes each film received by adults and children. Based on the data in this bar graph, which movie received 20% of the total votes? Show Work Please.