The graph shows the number of deaths in the United States due to accidents. Answer the following questions about the grapł Causes of Accidental Deaths in the United States 50 45
The graph shows the number of deaths in the United States due to accidents. Answer the following questions about the grapł Causes of Accidental Deaths in the United States 50 45

Glencoe Algebra 1, Student Edition, 9780079039897, 0079039898, 2018
18th Edition
ISBN:9780079039897
Author:Carter
Publisher:Carter
Chapter2: Linear Equations
Section: Chapter Questions
Problem 2PFA

Related questions
Question
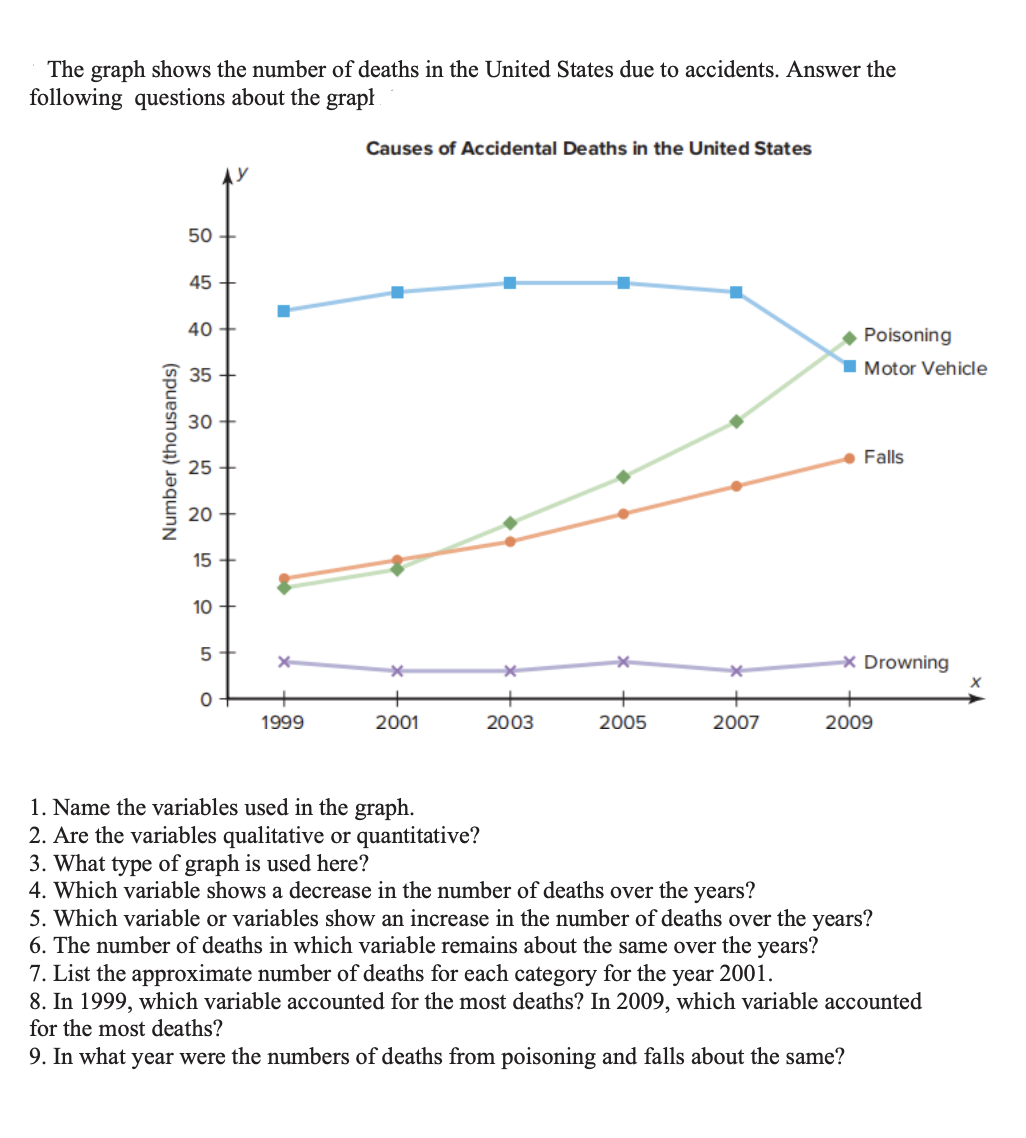
Transcribed Image Text:The graph shows the number of deaths in the United States due to accidents. Answer the
following questions about the grapł
Causes of Accidental Deaths in the United States
50 +
45
40
Poisoning
Motor Vehicle
35
30
Falls
25
20
15 +
10 +
X-
x Drowning
+
+
1999
2001
2003
2005
2007
2009
1. Name the variables used in the graph.
2. Are the variables qualitative or quantitative?
3. What type of graph is used here?
4. Which variable shows a decrease in the number of deaths over the years?
5. Which variable or variables show an increase in the number of deaths over the years?
6. The number of deaths in which variable remains about the same over the years?
7. List the approximate number of deaths for each category for the year 2001.
8. In 1999, which variable accounted for the most deaths? In 2009, which variable accounted
for the most deaths?
9. In what year were the numbers of deaths from poisoning and falls about the same?
Number (thousands)
Expert Solution
This question has been solved!
Explore an expertly crafted, step-by-step solution for a thorough understanding of key concepts.

This is a popular solution!

Trending now
This is a popular solution!

Step by step
Solved in 2 steps

Recommended textbooks for you
Glencoe Algebra 1, Student Edition, 9780079039897…
Algebra
ISBN:
9780079039897
Author:
Carter
Publisher:
McGraw Hill

Big Ideas Math A Bridge To Success Algebra 1: Stu…
Algebra
ISBN:
9781680331141
Author:
HOUGHTON MIFFLIN HARCOURT
Publisher:
Houghton Mifflin Harcourt

Algebra: Structure And Method, Book 1
Algebra
ISBN:
9780395977224
Author:
Richard G. Brown, Mary P. Dolciani, Robert H. Sorgenfrey, William L. Cole
Publisher:
McDougal Littell
Glencoe Algebra 1, Student Edition, 9780079039897…
Algebra
ISBN:
9780079039897
Author:
Carter
Publisher:
McGraw Hill
Big Ideas Math A Bridge To Success Algebra 1: Stu…
Algebra
ISBN:
9781680331141
Author:
HOUGHTON MIFFLIN HARCOURT
Publisher:
Houghton Mifflin Harcourt
Algebra: Structure And Method, Book 1
Algebra
ISBN:
9780395977224
Author:
Richard G. Brown, Mary P. Dolciani, Robert H. Sorgenfrey, William L. Cole
Publisher:
McDougal Littell
