Cost of Goods Sold $10,000,000 FIGURE 12.5 Calculating Inventory Measures Using Inventory Weeks of Operation 52 Item Number Average Level 1,400 Unit Value Estimator Solver Raw Materials Total Value $70,000 1 $50.00 2 1,000 $32.00 $32,000 3 400 $60.00 $10.00 $24,000 $24,000 4 2,400 $12,000 $224,000 800 Work in Process $15.00 $700.00 320 7 160 $900.00 $144,000 $210,000 $192,000 280 $750.00 $800.00 8 9 240 400 $1,000.00 $2,000.00 $400,000 $120,000 10 Finished Goods 11 60 12 40 $3,500.00 $140,000 13 50 $2,800.0 $5,000.00 $140,000 $100,000 14 20 40 $4,200.00 $168,000 $2,000,000 15 Total Average Weekly Sales at Cost $192,308 Weeks of Supply 10.4 Inventory Turnover 5.0
Cost of Goods Sold $10,000,000 FIGURE 12.5 Calculating Inventory Measures Using Inventory Weeks of Operation 52 Item Number Average Level 1,400 Unit Value Estimator Solver Raw Materials Total Value $70,000 1 $50.00 2 1,000 $32.00 $32,000 3 400 $60.00 $10.00 $24,000 $24,000 4 2,400 $12,000 $224,000 800 Work in Process $15.00 $700.00 320 7 160 $900.00 $144,000 $210,000 $192,000 280 $750.00 $800.00 8 9 240 400 $1,000.00 $2,000.00 $400,000 $120,000 10 Finished Goods 11 60 12 40 $3,500.00 $140,000 13 50 $2,800.0 $5,000.00 $140,000 $100,000 14 20 40 $4,200.00 $168,000 $2,000,000 15 Total Average Weekly Sales at Cost $192,308 Weeks of Supply 10.4 Inventory Turnover 5.0

Practical Management Science
6th Edition
ISBN:9781337406659
Author:WINSTON, Wayne L.
Publisher:WINSTON, Wayne L.
Chapter2: Introduction To Spreadsheet Modeling
Section: Chapter Questions
Problem 33P: Assume the demand for a companys drug Wozac during the current year is 50,000, and assume demand...

Related questions

Question
The Eagle Machine Company averaged $2 million in inventory last year, and the cost of goods sold was $10 million. Figure 12.5 shows the breakout of raw materials, work-in-process, and finished goods inventories. The best inventory turnover in the company’s industry is six turns per year. If the company has 52 business weeks per year, how many weeks of supply were held in inventory? What was the inventory turnover? What should the company do?
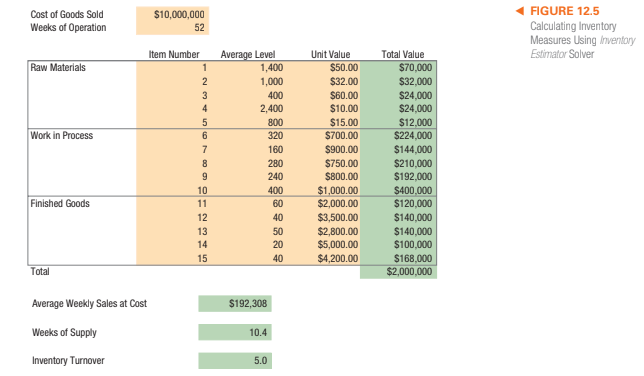
Transcribed Image Text:Cost of Goods Sold
$10,000,000
FIGURE 12.5
Calculating Inventory
Measures Using Inventory
Weeks of Operation
52
Item Number
Average Level
1,400
Unit Value
Estimator Solver
Raw Materials
Total Value
$70,000
1
$50.00
2
1,000
$32.00
$32,000
3
400
$60.00
$10.00
$24,000
$24,000
4
2,400
$12,000
$224,000
800
Work in Process
$15.00
$700.00
320
7
160
$900.00
$144,000
$210,000
$192,000
280
$750.00
$800.00
8
9
240
400
$1,000.00
$2,000.00
$400,000
$120,000
10
Finished Goods
11
60
12
40
$3,500.00
$140,000
13
50
$2,800.0
$5,000.00
$140,000
$100,000
14
20
40
$4,200.00
$168,000
$2,000,000
15
Total
Average Weekly Sales at Cost
$192,308
Weeks of Supply
10.4
Inventory Turnover
5.0
Expert Solution
This question has been solved!
Explore an expertly crafted, step-by-step solution for a thorough understanding of key concepts.

Step by step
Solved in 2 steps

Knowledge Booster


Learn more about
Need a deep-dive on the concept behind this application? Look no further. Learn more about this topic, operations-management and related others by exploring similar questions and additional content below.Recommended textbooks for you
Practical Management Science
Operations Management
ISBN:
9781337406659
Author:
WINSTON, Wayne L.
Publisher:
Cengage,
Practical Management Science
Operations Management
ISBN:
9781337406659
Author:
WINSTON, Wayne L.
Publisher:
Cengage,