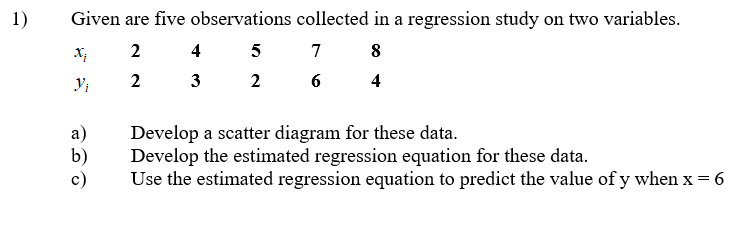
1) Given are five observations collected in a regression study on two variables. 2 4 5 7 8 2 3 6 4 a) b) c) Develop a scatter diagram for these data. Develop the estimated regression equation for these data. Use the estimated regression equation to predict the value of y when x = 6


Q: Transportation engineers determined that to help ease traffic, they would set up tolls for solo…
A: The type of the considered variable and the appropriate hypotheses that involve the "average no. of…
Q: A study by the National Park Service revealed that 50 percent of vacationers going to the Rocky…
A: The following information has been given: The probability of vacationers visit Yellowstone Park is…
Q: 4. Y = 0.43X + 1.1; X = 0.97 5. Y = X +:X = 6. Assume that the height of fathers (X) and the height…
A:
Q: A covariance of 0.01 between data set A and data set B indicates: 1. A strong tendency for B to…
A: Covariance measures the direction of relationship between two variables.
Q: Find the mean time spent by teenagers to watch series per day.
A: Let x denote the mid-poimt of class intervals, And f denotes the frequency.
Q: Find the following probability for the standard normal random variable z. a. P(z >1.15) b. P(z < -…
A: We have given the following probability. Note: According to Bartleby expert guidelines, we can…
Q: Range = Standard Deviation =
A: here given data 24 children , n =24
Q: Let X have the following probability density function A) find P(X < 1.1). B) find the 25th…
A: To find the percentiles first we need to find the CDF of X. That is why part C is done before part…
Q: - Rusiness owners on Suffern Main street claim that the mean peed of automobiles traveling on their…
A: Disclaimer : Since you have asked multiple question, we will solve the first question for you. If…
Q: A genetic experiment with peas resulted in one sample of offspring that consisted of 445 green…
A: a. Construct a 90% confidence interval to estimate of the percentage of yellow peas.b. It was…
Q: A manufacturer knows that their items have a normally distributed lifespan, with a mean of 12.1…
A: The items are normally distributed with mean 12.1 and variance 1.1 μ=12.1σ=1.1
Q: A Type I error is committed when (A we retain a null hypothesis that is true. B we reject a null…
A:
Q: Table 5. Summary of Stocking Density at each level of Kind of Feed Stocking_density N Kind of_Feed =…
A: Given Information: Variable of interest= Kind of feedLevel of stocking density=3Total no. of…
Q: 5.The weights of adult males are normally distributed with mean of 172 pounds and a standard…
A:
Q: Which of the following sampling techniques is considered as a method of probability sampling? A…
A: Non Probability Sampling: If a sample is not chosen based on probability known as the method of…
Q: Twenty years ago, 47% of parents of children in high school felt it was a serious problem that high…
A: Given that Sample size n =900 Population proportion p=47%=0.47
Q: INSTRUCTION: Using all the given information and/or the data below, construct the FDT and compute…
A: Frequency distribution is the representation of data in a table format, in a frequency distribution…
Q: Determine the area under the standard normal curve that lies to the left of (a) Z= -0.17, (b) Z=…
A:
Q: 6. In an electrophoretic fiber-making process, the diameter of the fiber, d, is related to the…
A:
Q: Example 22.12 The following table gives the number of defects observed in 7 carpets passed as satis-…
A:
Q: Create necessary columns of data necessary to solve the problem a. Determine the size of the public…
A:
Q: Calculate the correlation coefficient r, letting Row 1 represent the x-values and Row 2 the…
A:
Q: Using your calculator, find the range and standard deviation, round to two decimals places: The…
A: List of formulae : Range = Maximum value - Minimum value Sample standard deviation : s = ∑x2-∑x2nn-1
Q: In the space below (or on a separate sheet of paper), plot all observations of the table above and…
A: Steps to plot of the data and regression line using Excel is obtained as follows: Enter the data in…
Q: An article in the Journal of Sound and Vibration (Vol. 151, 1991, pp. 383-394) described a study…
A:
Q: The city of Wenatchee, Washington, employs people to assess the value of homes for the purpose of…
A: Disclaimer : “Since you have posted a question with multiple sub-parts, we will solve first three…
Q: student is asked to estimate the mean height of all male students on campus. She decides to use the…
A: *Answer:
Q: 37.5 5.9894 37.9 7.5422 44.5 8.7951 37.9 6.0831 38.9 8.3607 36.9 8.1400 45.8 9.1416 (a) Calculate…
A:
Q: Example 20.3 Construct weighted relative price indices, using the data given in Table 20.4.
A:
Q: The mean monthly salary of 32 men is P28,500 while that of 38 women is P24,400. Find the mean salary…
A:
Q: What is the probability that a sample size 7 out of 15 identified people will have a mean of weight…
A:
Q: Method A: Randomly divide a group of 100 people with minor cuts into two groups. Have each group use…
A: The appropriate nature (i.e., survey, observation, or experiment) of the considered methods, which…
Q: Example 19.9 Suppose we have the following series of 29 college students. After performing a set of…
A:
Q: Show your complete solution with conclusion. 1. XYZ University claims that the average time for all…
A: A hypothesis which is tested for plausible rejection is called the Null Hypothesis (typically…
Q: Which of the following is not a characteristic of a normal distribution? A The mean, median, and…
A:
Q: A random sample of n1 = 55 stemmed projectile points showed the mean length to be x1 = 3.00 cm, with…
A: There are two independent samples which are stemmed and stem less. We have to test whether there is…
Q: Suppose the random variable x is best described by a normal distribution with p = 26 and o= 5. Find…
A: We have given that Mean = 26 Standard deviation = 5 Note: According to Bartleby expert guidelines,…
Q: You roll two dice and record the sum shown. The sample space is the set of all possible sums, which…
A: You roll two dice and record the sum shown. The sample space is the set of all possible sums, which…
Q: Teachers in a certain private school have a mean age of 38 years with a standard deviation of 6…
A: Solution: Given information: Teachers ages mean and standard deviation are Mean = μ1= 38Standard…
Q: 3. A random sample of 1000 students was selected from among the senior high school students across…
A: Given sample size, n=1000 sample mean, x¯=2 h population standard deviation, σ=1.5 h
Q: ACTIVITY Predict the value of Y given the regression line and the value of X in each item. 1. Y =…
A: Since you have posted a question with multiple sub-parts, we will solve first 3 subparts for you. To…
Q: Which of the following is used in making the optimal decision? a. Branch probabilities for all of…
A: We have given following is used in making the optimal decision.
Q: A population has a mean age of 30 with a standard deviation of 10. Considering that the given…
A: From the provided information, Mean (µ) = 30 Standard deviation (σ) = 10 X~N (30, 10)
Q: A previous study claims that the average time a teenager spends browsing his social media accounts…
A:
Q: Suppose the marketing research firm would like to examine if the social networking site that a…
A: For the given data Perform Chi square test
Q: pon arrival at a hospital's emergency room, patients are categorized according to their condition as…
A:
Q: 3. The data below are those obtained for a group of 10 subjects on a choice- reaction time…
A:
Q: Assume that a procedure yields a binomial distribution with a trial repeated n=5 times. Use some…
A:
Q: If n=530 and ˆpp^ (p-hat) =0.75, find the margin of error at a 90% confidence level Give your…
A: Givenn=530p^=0.75confidence level=90%
Q: 1. Using the data computed, test the null hypothesis that there is no significant difference between…
A: Weneed to test the null hypothesis that there is no significant difference between the population…

Step by step
Solved in 4 steps with 3 images

- Olympic Pole Vault The graph in Figure 7 indicates that in recent years the winning Olympic men’s pole vault height has fallen below the value predicted by the regression line in Example 2. This might have occurred because when the pole vault was a new event there was much room for improvement in vaulters’ performances, whereas now even the best training can produce only incremental advances. Let’s see whether concentrating on more recent results gives a better predictor of future records. (a) Use the data in Table 2 (page 176) to complete the table of winning pole vault heights shown in the margin. (Note that we are using x=0 to correspond to the year 1972, where this restricted data set begins.) (b) Find the regression line for the data in part ‚(a). (c) Plot the data and the regression line on the same axes. Does the regression line seem to provide a good model for the data? (d) What does the regression line predict as the winning pole vault height for the 2012 Olympics? Compare this predicted value to the actual 2012 winning height of 5.97 m, as described on page 177. Has this new regression line provided a better prediction than the line in Example 2?Given are five observations collected in a regression study on two variables. xi 2 6 9 13 20 yi 9 19 7 26 21 Develop the estimated regression equation for these data. ŷ = (c) Use the estimated regression equation to predict the value of y when x = 6.Given are five observations collected in a regression study on two variables. xi 2 6 9 13 20 yi 9 18 8 25 21 (b) Develop the estimated regression equation for these data. ŷ = (c) Use the estimated regression equation to predict the value of y when x = 13.
- The following table gives the marks obtained by 10 students in POLI 344 (X) together with the marks obtained in the exam in POLI 308 (Y). POLI 344 (X)8 8 9 10 10 11 12 13 13 11 14 POLI 443 (Y) 7 11 8 7 12 11 10 12 14 17 15 (i) State the two equation lines of the regression line. (ii) If a student was absent from POLI 443 but scored 18 in POLI 344 (X) state the regression line, which would be suitable for estimating his/her possible mark in POLI 443 and work out a fair estimate for his /her possible mark.Years of Work Experience and number of Job Offers of 10 job-seekers were as follows: Work Exp. 4 2 5 3 7 12 2 5 4 9 No. of Offers 7 1 8 4 13 19 3 11 9 15 a. Fit the regression equation of No. of Job Offers on Years of Work Experience. b. What will be the predicted number of offers for an applicant with 6 years of experience? c. Verify the relationship between the number of job offers and years of work experience using at least two relevant methodsThe following estimated regression equation is based on 10 observations yhat = 30.12 + .60x1 + .48x2 SST = 680.3, SSR= 601.4, Sb1 = .0813 and Sb2 = .0567 a. Compute MSR and MSE b. Compute F and perform the appropriate F test. Use alpha = .05. c. Perform a t test for the significance of B1. Use alpha = .05. d. Perform a t test for the significance of B2. Use alpha = .05.
- Given are five observations for two variables, x and y. xi 1 2 3 4 5 yi 4 6 6 11 13 Develop the estimated regression equation by computing the values of b0 and b1 using b1 = Σ(xi − x)(yi − y) Σ(xi − x)2 and b0 = y − b1x. ŷ = (e) Use the estimated regression equation to predict the value of y when x = 2.Suppose that the sales of a company (Y) is regressed on advertising expenditure (x) and labor cost (z), and the estimated regression equation is Y = 5 + 0.5x + 0.7z + u (where u is the error term). Here, sales, advertising expenditure and labor cost are measured in million Tk. Standard error for the coefficient of x is 0.04, standard error for the coefficient of z is 0.01, and the sample size is 20. Can we conclude that advertising expenditure is a statistically significant variable?n are five observations collected in a regression study on two variables. xi 2 6 9 13 20 yi 7 18 9 26 23 (a) Develop a scatter diagram for these data. (b) Develop the estimated regression equation for these data. ŷ = _______ (c) Use the estimated regression equation to predict the value of y when x = 9. ______
- Use the following results obtained from a simple linear regression analysis with 12 observations. Y = 37.2895- (1.2024)X Sb = 0.2934 Test to determine if there is a significant negative relationship between the independent and dependent variables at alpha= .05. Give the resulting conclusion. a. is rejected. B.cannot be tested with the given information. c. is not rejected. D. is not an appropriate null hypothesis for this situation.Given are five observations collected in a regression study on two variables. xi 2 6 9 13 20 yi 7 18 9 26 23 Compute b0 and b1 (to 1 decimal).b1 b0 Complete the estimated regression equation (to 1 decimal).^y = + x Use the estimated regression equation to predict the value of y when x = 6 (to 1 decimal).^y =The Update to the Task Force Report on Blood Pressure Control in Children [12] reported the observed 90th per-centile of SBP in single years of age from age 1 to 17 based on prior studies. The data for boys of average height are given in Table 11.18. Suppose we seek a more efficient way to display the data and choose linear regression to accomplish this task. age sbp 1 99 2 102 3 105 4 107 5 108 6 110 7 111 8 112 9 114 10 115 11 117 12 120 13 122 14 125 15 127 16 130 17 132 Do you think the linear regression provides a good fit to the data? Why or why not? Use residual analysis to justify your answer. Am I supposed to run a residual plot and QQ-plot for this question?