1) In recent years many states have passed mandatory seat belt laws. The total number N of states that had a seat belt law in effect : years after 1984 is given by the graph below. Express the number of states with seat belt laws in effect in 1987 using function notation. Then use the graph to estimate its value. Make sure to include appropriate units. Pyeare b) In what year were there seat belt laws in effect in 40 states? When was the graph concave up? Explain how the number of states with seat belt laws was changing during this period (i.e. increase, decrease at what kind of rate). sasN
1) In recent years many states have passed mandatory seat belt laws. The total number N of states that had a seat belt law in effect : years after 1984 is given by the graph below. Express the number of states with seat belt laws in effect in 1987 using function notation. Then use the graph to estimate its value. Make sure to include appropriate units. Pyeare b) In what year were there seat belt laws in effect in 40 states? When was the graph concave up? Explain how the number of states with seat belt laws was changing during this period (i.e. increase, decrease at what kind of rate). sasN

Algebra & Trigonometry with Analytic Geometry
13th Edition
ISBN:9781133382119
Author:Swokowski
Publisher:Swokowski
Chapter4: Polynomial And Rational Functions
Section4.3: Zeros Of Polynomials
Problem 54E

Related questions

Concept explainers
Contingency Table
A contingency table can be defined as the visual representation of the relationship between two or more categorical variables that can be evaluated and registered. It is a categorical version of the scatterplot, which is used to investigate the linear relationship between two variables. A contingency table is indeed a type of frequency distribution table that displays two variables at the same time.
Binomial Distribution
Binomial is an algebraic expression of the sum or the difference of two terms. Before knowing about binomial distribution, we must know about the binomial theorem.
Topic Video
Question
100%
1
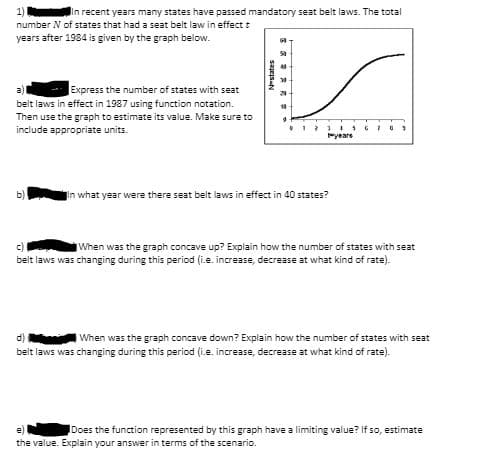
Transcribed Image Text:1)
In recent years many states have passed mandatory seat belt laws. The total
number N of states that had a seat belt law in effect t
years after 1984 is given by the graph below.
a)l
Express the number of states with seat
20
belt laws in effect in 1987 using function notation.
Then use the graph to estimate its value. Make sure to
include appropriate units.
yeare
b)
In what year were there seat belt laws in effect in 40 states?
c)
belt laws was changing during this period (i.e. increase, decrease at what kind of rate).
When was the graph concave up? Explain how the number of states with seat
IWhen was the graph concave down? Explain how the number of states with seat
belt laws was changing during this period (i.e. increase, decrease at what kind of rate).
d)
Does the function represented by this graph have a limiting value? If so, estimate
the value. Explain your answer in terms of the scenario.
sages-N
Expert Solution
This question has been solved!
Explore an expertly crafted, step-by-step solution for a thorough understanding of key concepts.

This is a popular solution!

Trending now
This is a popular solution!

Step by step
Solved in 3 steps with 3 images

Knowledge Booster


Learn more about
Need a deep-dive on the concept behind this application? Look no further. Learn more about this topic, advanced-math and related others by exploring similar questions and additional content below.Recommended textbooks for you
Algebra & Trigonometry with Analytic Geometry
Algebra
ISBN:
9781133382119
Author:
Swokowski
Publisher:
Cengage

Mathematics For Machine Technology
Advanced Math
ISBN:
9781337798310
Author:
Peterson, John.
Publisher:
Cengage Learning,
Algebra & Trigonometry with Analytic Geometry
Algebra
ISBN:
9781133382119
Author:
Swokowski
Publisher:
Cengage
Mathematics For Machine Technology
Advanced Math
ISBN:
9781337798310
Author:
Peterson, John.
Publisher:
Cengage Learning,