1 Show that r in (6.16) is the square of the correlation (x - )(Vi – y) %3= as given by (6.18).


Q: 5. After watching a number of children playing games in a video arcade, a statistics practitioner…
A: Given that -
Q: we are going to model the Ball Toss with a quadratic function. So, at 30 cm intervals, we draw 4…
A: Given information: Note: As per guidelines we will only answer the first three subparts, please…
Q: Consider the following data representing the price of plasma televisions (in dollars). 1251, 1315,…
A: The table is given below,
Q: Athletes at a certain university have a long term graduation rate of 0.60 or 60%. The sampling…
A: Given that n =300 ,p =0.6 σp^= ?
Q: Decision: 3.25 Zcritical = 1.28 5. Zcomputed Decision: %3D %3D
A: According to the given information in this question We need to identify the correct decision
Q: By referring to the first graph, the define the type of risks: 1.1. Total Risk. 1.2.…
A: The define the type of risks: Total Risk. Systematic Risk (Non-Diversifiable Risk) Unsystematic…
Q: a movie theater considrs upgrading to offer luxery seating the mananger randomly surfeys 1200…
A: Given that, a movie theater considrer upgrading to offer luxery seating. The mananger randomly…
Q: A control chart is to be started for a new machine that fills boxes of cereal by weight. Five…
A: Solution: As per the guidelines first three parts should be answered. If the remaining parts needed…
Q: equation of the regression ine is yDO und to two decimal places as needed) nstruct a scatter plot of…
A:
Q: Scores on a Test Class Frequency 50-57 14 58-65 66-73 10 74-81 8 82-89 9. Step 3 of 5: Determine the…
A: Solution-: We have following frequency distribution table: Score on a test Class Frequency…
Q: 7. If x1, x2 and x3 are three variates measured from their respective means as origin and if e, is…
A:
Q: Explain which of the following is a two-tailed test, a left-tailed test, or a right-tailed test H: µ…
A: a) here Ho : mu = 12 vs H1 : mu <12 This is one tailed test This is left tailed test.
Q: Which of the following statements is correct for the sampling distribution of the proportion for…
A: here given , Consider the sampling distribution of the proportion of athletes that graduate for…
Q: You’ve been wondering about the latest rise in taxi services, such as Uber and Lyft. You wondered if…
A: Solution: Given information: n= 67 sample size k= 2 categories We are interested in testing the…
Q: One of the most feared predators is the great white shark, which can grow to a mean length of 21…
A: Given, population mean (µ) = 21 sample size (n) = 3
Q: An estimated 78.1% of U.S. households had high-speed internet connection in 2013. A researcher wants…
A: Given that - An estimated 78.1% of U.S. households had high-speed internet connection in 2013. A…
Q: noihalunoq d Exercises rpe enbje ase d ng hobrpts edi ei Read and answer the following problems.…
A:
Q: (150)4. HBK, a food industry company wants to build a forecasting model to predict the sales of its…
A:
Q: estimate of for the following. E = .17, ? = .90, confidence level = 99%
A: (1) We have given that, Population proportion (p) = 0.90, margin of error (E) = 0.17 and…
Q: An aircraft is used to fire at a target. It will be successful if 2 or more bombs hit the target. If…
A:
Q: A magazine ran a sweepstakes in which prizes were listed along with the chances of winning:…
A:
Q: percentage of vehicles with the following speeds on this section of I-95: greater than 75 mph. Use…
A: here given Suppose that on a certain section of I-95, with a posted speed limit of 65 miles per…
Q: A coach uses a new technique in training middle distance runners. The times for 8 different athletes…
A: Solution:- From given information claim:-The training helps to improve the athletes' times for the…
Q: At the 5% significance level, does it appear that price of bus trips per week, population or average…
A: Solution: Given information: k= 4 independent variables n= 26 observation.
Q: The data are shown in the table below. At a = 0.05, can it be concluded that there is a significant…
A: Given: n = 18 k = 3
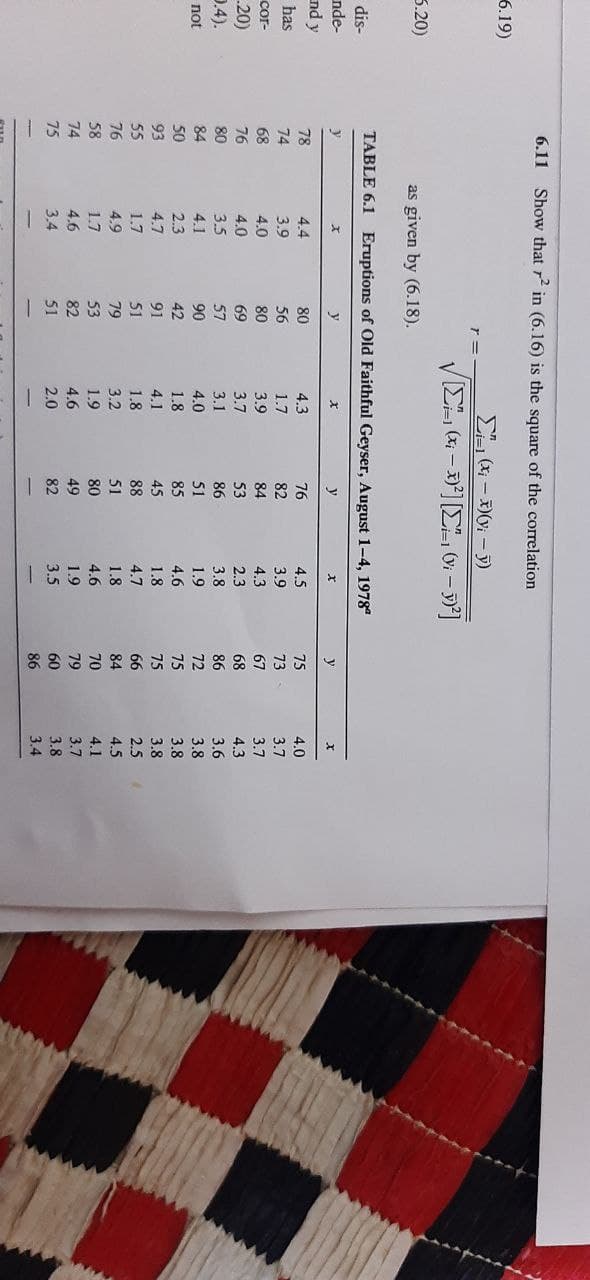
Q: 6.11 Show that r in (6.16) is the square of the correlation E (x; - )(y; -y)
A: From the given information, y x Y-Y¯2 X-X¯2 X-X¯Y-Y¯ 78 4.4 47.16805 0.875722 6.426981 74…
Q: Cost of a Paperback Book (in Dollars) Class Frequency 7.4-7.9 3 8.0-8.5 14 8.6-9.1 9. 9.2-9.7 7.…
A: Solution-: We have given following table: Cost of Paperback Book (in Dollars) Class Frequency…
Q: Solve the given problem: 1. In an attempt to assess the effect of the length of time spent in using…
A:
Q: Suppose X1,.. , X, iid Beta(a,ß) 1. Find the LRT “Likelihood ratio test for Ho: a = B = 1 versus…
A: Note: Hi there! Thank you for posting the question. As you have posted multiple questions, as per…
Q: Suppose that hemoglobin levels in white males over age 11 are normally distributed with variance…
A: For the given data Perform z test for independent samples
Q: 6.13 Show that t = %3D VI - r in (6.2
A:
Q: Ten competitors in a beauty contest are ranked by three judges in the following order: 8. 10 3 4 9.…
A:
Q: Q 1 (a) Enter the following data into PSPP : STUDENT NAME…
A: The given data has been entered into the SPSS in the following steps as follows: Go to 'Variable…
Q: Q4/ Find the theoretical values for linear equation (y) from the given data Xi 3 6 12 15 18 21 24 27…
A: When we want to predict the value of one variable, say y, from the given value of another variable,…
Q: Below are the ozone concentrations in random samples of areas of Metro Manila and the rest of…
A:
Q: Can the economist conclude that the mean FICO score is greater than 720
A: Given: Sample size,n=120Population mean μ=720Sample meanx¯=740Sample standard deviation…
Q: 1. What is the probability that out 393 confirmed cases 198 has recovered? a. 198/393 b. 50.38% 2.…
A: For the given Select the correct choice
Q: 3. The marks obtained by the students in a class as given below. Find the Range and its coefficient.…
A:
Q: 10. If x1, x2 and x3 are three variates measured from their respective means as origin and of equal…
A:
Q: Ten novels were randomly selected, and the number of pages were recorded as follows: 415 398…
A: We have given that, The data set of novels are :- 415 398 402 399 400 405 395 401…
Q: 6.8 Obtain a test for Ho: B =
A:
Q: Investigation 43 PATTERNS For these rectangles, 2 3 4 5 6 7 8. 9 10 11 12 7 x 3 - 9 x 1 - 12, %3D 13…
A: Here given pattern, For rectangle, we have to tell, How, LHS = RHS
Q: ngle, a double, or a triple burger. You also have a choice of whether to include pickles, mustard,…
A: Heinz's Burger Place Size Single Double Triple Extra Toppings Available Pickles…
Q: 27.The student government claims that 70% of all students favor an increase in student fees to buy…
A:
Q: 70)2. Artie Siegel, an MBA student, has been having problems balancing his checkbook. His monthly…
A:
Q: Find 1-a Conf int for P( - tery}u LT L tarziv) =l-a
A:
Q: Scores on a history test have average of 80 with standard deviation of 6. What is the z-score for a…
A:
Q: a) Construct a 99% confidence interval estimate for the population mean amount of paint included in…
A:
Q: As a general rule, is it advisable to difference a time-series more than 1–2 times? Why or why not?
A: The objective is specify whether it is advisable to difference a time-series more than 1–2 times.
Q: Hours Students Watch TV in a Week Class Frequency 19-25 26-32 7. 33-39 12 40-46 7. 47-53 11…
A: From the provided information, Hours students watch TV in a Week Class Frequency 19-25…


Trending now
This is a popular solution!

Step by step
Solved in 2 steps with 1 images

- A)I will test the claim that there is no correlation (start with the Claim and finish with the conclusion) The best estimate The P value is (big/small) so I have to (either give the average of the y's or plug in the x into the y-=mx+b)A snack food manufacturer estimates that the variance of the number of grams of carbohydrates in servings of its tortilla chips is 1.33. A dietician is asked to test this claim and finds that a random sample of 24 servings has a variance of 1.37. At α=0.01, is there enough evidence to reject the manufacturer's claim? Assume the population is normally distributed. Complete parts (a) through (e) below. (a) Write the claim mathematically and identify H0 and Ha. A. H0: σ2≤1.33 (Claim) Ha: σ2>1.33 B. H0: σ2≠1.33 Ha: σ2=1.33 (Claim) C. H0: σ2≥1.33 Ha: σ2<1.33 (Claim) D. H0: σ2=1.33 (Claim) Ha: σ2≠1.33 (b) Find the critical value(s) and identify the rejection region(s). The critical value(s) is(are) enter your response here. (Round to two decimal places as needed. Use a comma to separate answers as needed.) Choose the correct statement below and fill in the corresponding answer boxes. A. The…12/20 Compute the linear correlation coefficient between the weight of a car and its miles per gallon. R =_. Round to three decimal places as needed.
- Are the following results significant at α=.01? F(2,27) =10.56, p=.02 Yes No 2. A large F-ratio (or a significant result) is the result of: a small amount variability within the groups and a large amount of variability between the groups a large amount variability within the groups and a small amount of variability between the groups a large amount variability within the groups and a large amount of variability between the groups a small amount variability within the groups and a small amount of variability between the groupsA dietitian wishes to see if a person’s cholesterol level will be changed if the diet is supplemented by a certain mineral. Four subjects were pre-tested, and they took the mineral supplement for a 6-week period. The results are shown in the table. Is there sufficient evidence to conclude that the population mean of cholesterol levels has been changed after six weeks at α=0.2α=0.2? Assume that the differences are from an approximately normally distributed population. Subject Cholestrol Level (mg/dl) Cholestrol Level after 6 Weeks (mg/dl) dd ¯dd¯ (d−¯d)2(d-d¯)2 1 206 217 11 2 219 184 -35 3 202 204 2 4 213 205 -8 Total -30 a) Calculate the mean, the sum of the squared deviation from the mean, and the standard deviation of differences. Do not include the unit for each answer: ¯d=d¯= (do not round) ∑(d−¯d)2=∑(d-d¯)2= (do not round) sd=sd= (rounded to one decimal place) b) Perform the hypothesis test in the following steps: Step 1.…Suppose that index model for Stocks A and B is estimated from excess returns with the following results : Ra 0.04 +0.6Rm+ea , Rb = - 0.04 + 1.3Rm + eb Risk on the market is 30% , R-squared of A is 30%R - squared of B is 40% , security A residual variance is
- T/F: An analysis was performed on data relating the number of weeks of experience in a job involving the wiring of electronic components and the number of components that were rejected during the past week for 12 randomly selected workers. The analysis is as follows: There is no apparent relationship between experience and rejects produced. True FalseIf the value of Cronbach’s alpha is 0.07, it means ___________; a. Research instrument is not reliable b. Research instrument is internally consistent c. Data is reliable d. Data is internally consistentA major credit card company is interested in whether there is a linear relationship between its internal rating of a customer’s credit risk and that of an independent rating agency. The company collected a random sample of 200 customers and used the data to test the claim that there is a linear relationship. The following hypotheses were used to test the claim. H0:β1=0Ha:β1≠0 The test yielded a t-value of 3.34 with a corresponding p-value of 0.001. Which of the following is the correct interpretation of the p-value? If the alternative hypothesis is true, the probability of observing a test statistic at least as extreme as 3.34 is 0.001. If the alternative hypothesis is true, the probability of observing a test statistic at least as extreme as 3.34 is 0.001. A If the alternative hypothesis is true, the probability of observing a test statistic of 3.34 or greater is 0.001. If the alternative hypothesis is true, the probability of observing a test statistic of 3.34 or greater…
- Suppose that the index model for two Canadian stocks HD and ML is estimated with the following results: RHD =-0.03+2.10RM+eHD R-squared =0.7 RML =0.06+1.60RM+eML R-squared =0.6 σM =0.15 where M is S&P/TSX Comp Index and RX is the excess return of stock X. What is the covariance and the correlation coefficient between HD and ML?A test of H0H0:μ=1:μ=1 against HaHa:μ>1:μ>1 has test statistic zz = 1.74. Answer "Yes/Y" or "No/N" to the following questions. Is this test significant at the 2.5% level (αα = 0.025)? Is it significant at the 0.5% level (αα = 0.005)?What type of statistical test are you conducting if h1 states that the parameter is greater than the value claimed in h0? a) left-tailed b) right-tailed c) two-tailed d) dove-tailed