1 Situation: The "Small Town Restaurant" uses a forecast of weekly sales revenue to plan their inventory ordering and staffing for the upcoming week. They have been using a regression forecast for the past year and wonder if it is the most accurate method. You have been brought in to determine if another forecasting technique would be more accurate. Data for their weekly sales for the past year is below: 1 Forecasting-Small Town Restaurant Week Revenue B Week 1x $3,157. 14 2 $3,016 15 3 $3,062¤ ¤ 16 4 $3,074¤ ¤ 17 5 $3,002-¤¤ 18 $3,046 6 $3,054-¤¤ 19 $3,157 ¤ 7 $3,002-¤¤ 20 $3,016 8 $ 2,984¤ ¤ 21 $3,078 ¤ 9 $3,078¤ ¤ 22 $2,984 ¤ 10 $3,010- 23 $3,002 11 $3,148 24 $3,054 ¤ 12 25 $3,002 ¤ $3,146 $3,198 13 26 $2,941 X ¤ ¤ Revenue $3,157 ¤ $3,016 ¤ $3,019 ¤ $3,045 ¤ Revenue. 27 $2,899 ¤ ¤ 28 $2,942 29 $3,062 ¤ 30 $3,074 ¤ 31 $3,013 ¤ 32 $3,067 ¤ 33 $3,148 34 $3,146 ¤ 35 $3,198 ¤ 36 $3,082 ¤ 37 $3,146 ¤ 38 $3,150 ¤ 39 $3,221 Week Week Revenue B 40 $3,298 41 $3,201. 42 $3,156 43 $3,017. 44 $3,156. 45 $3,097. 46 $2,978 ¤ ¤ 47 $3,120 48 $3,156 49 $3,048 50 $2,948 51 $ 2,840 52 $2,921. $ 159,532 Annual total You will use this data in the next few steps to complete various time series forecasts and compare them to determine the most accurate method.
1 Situation: The "Small Town Restaurant" uses a forecast of weekly sales revenue to plan their inventory ordering and staffing for the upcoming week. They have been using a regression forecast for the past year and wonder if it is the most accurate method. You have been brought in to determine if another forecasting technique would be more accurate. Data for their weekly sales for the past year is below: 1 Forecasting-Small Town Restaurant Week Revenue B Week 1x $3,157. 14 2 $3,016 15 3 $3,062¤ ¤ 16 4 $3,074¤ ¤ 17 5 $3,002-¤¤ 18 $3,046 6 $3,054-¤¤ 19 $3,157 ¤ 7 $3,002-¤¤ 20 $3,016 8 $ 2,984¤ ¤ 21 $3,078 ¤ 9 $3,078¤ ¤ 22 $2,984 ¤ 10 $3,010- 23 $3,002 11 $3,148 24 $3,054 ¤ 12 25 $3,002 ¤ $3,146 $3,198 13 26 $2,941 X ¤ ¤ Revenue $3,157 ¤ $3,016 ¤ $3,019 ¤ $3,045 ¤ Revenue. 27 $2,899 ¤ ¤ 28 $2,942 29 $3,062 ¤ 30 $3,074 ¤ 31 $3,013 ¤ 32 $3,067 ¤ 33 $3,148 34 $3,146 ¤ 35 $3,198 ¤ 36 $3,082 ¤ 37 $3,146 ¤ 38 $3,150 ¤ 39 $3,221 Week Week Revenue B 40 $3,298 41 $3,201. 42 $3,156 43 $3,017. 44 $3,156. 45 $3,097. 46 $2,978 ¤ ¤ 47 $3,120 48 $3,156 49 $3,048 50 $2,948 51 $ 2,840 52 $2,921. $ 159,532 Annual total You will use this data in the next few steps to complete various time series forecasts and compare them to determine the most accurate method.

Functions and Change: A Modeling Approach to College Algebra (MindTap Course List)
6th Edition
ISBN:9781337111348
Author:Bruce Crauder, Benny Evans, Alan Noell
Publisher:Bruce Crauder, Benny Evans, Alan Noell
Chapter5: A Survey Of Other Common Functions
Section5.6: Higher-degree Polynomials And Rational Functions
Problem 1TU: The following fictitious table shows kryptonite price, in dollar per gram, t years after 2006. t=...

Related questions
Question
What would be the simple linear regression (trend projection) forecast for week 4 and for week 53 for Small Town Restaurant (see file) if the regression equation for our data is: y = 3061.7 + 0.2364x ? Provide two decimal places and use normal rounding.
Transcribed Image Text:
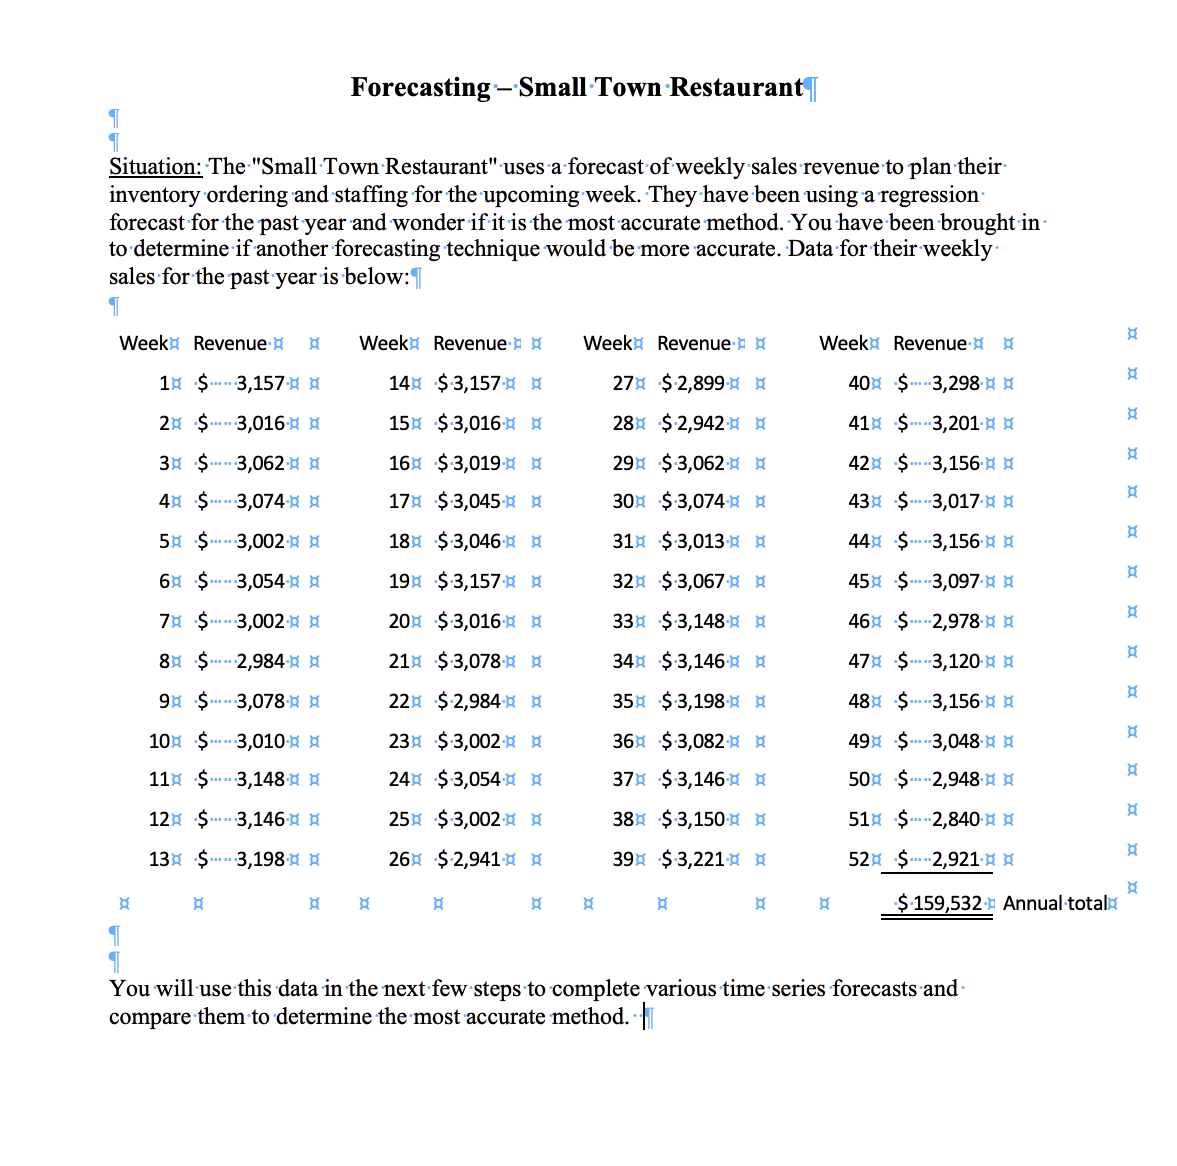
Situation: The "Small Town Restaurant" uses a forecast of weekly sales revenue to plan their
inventory ordering and staffing for the upcoming week. They have been using a regression
forecast for the past year and wonder if it is the most accurate method. You have been brought in
to determine if another forecasting technique would be more accurate. Data for their weekly
sales for the past year is below:
Week Revenue. X Week
1
2 $3,016
3 $3,062.¤ ¤
4
$ 3,074. X
5
$3,002.
6
----3,054-¤¤
7 $3,002.¤ ¤
8
9
$3,078¤ ¤
10 $3,010- X
11 $3,148.
12
$3,146
$3,198.
13
X
$3,157.**
$
Forecasting S
$ 2,984-¤¤
A
- Small Town Restaurant
Revenue.
14 $3,157 ¤
$3,016
¤
15
16 $3,019
¤
17 $3,045
¤
18
19
$3,046 ¤
$3,157 ¤
$3,016 ¤
$3,078 ¤
22 $2,984
20
21
¤
23 $3,002 ¤
24 $3,054 ¤
25 $3,002 ¤
26 $2,941 X
A
Week
Revenue.
27 $2,899 ¤
28 $2,942
¤
29 $3,062 X
¤
30 $3,074
31 $3,013 ¤
¤
32 $3,067
33 $3,148 ¤
34 $3,146
¤
35 $3,198 ¤
36 $3,082 ¤
37 $3,146 ¤
38 $3,150 ¤
39 $3,221 ¤
X
B
Week Revenue. ¤
40 $3,298.
41 $3,201.
42 $3,156.
43 $3,017. X
44 $3,156.
45 $3,097.
46 $ 2,978. X
47 $3,120
48 $3,156.
49 $3,048.
50 $2,948.
51 $ 2,840.
52 $2,921.
X
$ 159,532 Annual total
You will use this data in the next few steps to complete various time series forecasts and
compare them to determine the most accurate method.
¤¤¤¤¤¤¤¤¤¤¤¤¤¤¤
X{
X{
X{
X{
Expert Solution
This question has been solved!
Explore an expertly crafted, step-by-step solution for a thorough understanding of key concepts.

Step by step
Solved in 3 steps with 4 images

Recommended textbooks for you
Functions and Change: A Modeling Approach to Coll…
Algebra
ISBN:
9781337111348
Author:
Bruce Crauder, Benny Evans, Alan Noell
Publisher:
Cengage Learning

College Algebra
Algebra
ISBN:
9781305115545
Author:
James Stewart, Lothar Redlin, Saleem Watson
Publisher:
Cengage Learning

Algebra and Trigonometry (MindTap Course List)
Algebra
ISBN:
9781305071742
Author:
James Stewart, Lothar Redlin, Saleem Watson
Publisher:
Cengage Learning
Functions and Change: A Modeling Approach to Coll…
Algebra
ISBN:
9781337111348
Author:
Bruce Crauder, Benny Evans, Alan Noell
Publisher:
Cengage Learning
College Algebra
Algebra
ISBN:
9781305115545
Author:
James Stewart, Lothar Redlin, Saleem Watson
Publisher:
Cengage Learning
Algebra and Trigonometry (MindTap Course List)
Algebra
ISBN:
9781305071742
Author:
James Stewart, Lothar Redlin, Saleem Watson
Publisher:
Cengage Learning