1- Solve for the missing values (yellow highlighted)in the following table and test for the global usefulness of the model using a=0.01. Identify the null and the alternative hypotheses and the test statistic.< SUMMARY OUTPUT Regression Statistics Multiple Re R Square Adjusted R Square e Standard Errore Observations ANOVA SS MS Regression 197910754.8 Residual 562923.1651 Total 29 210857987.6 Coefficients Standard Errore t State Intercept 496.6700458 3409.504939 0.145672188 FARE -204.3225415 -0.415423264 GASPRICE 3316.072656 0.47013468 INCOME -0.093980627 0.102729232 -0.914838208 POPO 0.29637716 e DENSITY 0.056142541 0.0892985 0.628706423 LANDAREA -1.744165638 2.234037353 -0.780723579 e df P-value (3 Lower 95% Upper 95% -6556.428293 7549.768385 -1221.7749 813.1298174 -5300.81818 8418.819692 -0.306492236 0.118530982 1.19691454 2.423120274 -0.128585481 0.240870562 -6.365624011 2.877292734 tttttttt R
1- Solve for the missing values (yellow highlighted)in the following table and test for the global usefulness of the model using a=0.01. Identify the null and the alternative hypotheses and the test statistic.< SUMMARY OUTPUT Regression Statistics Multiple Re R Square Adjusted R Square e Standard Errore Observations ANOVA SS MS Regression 197910754.8 Residual 562923.1651 Total 29 210857987.6 Coefficients Standard Errore t State Intercept 496.6700458 3409.504939 0.145672188 FARE -204.3225415 -0.415423264 GASPRICE 3316.072656 0.47013468 INCOME -0.093980627 0.102729232 -0.914838208 POPO 0.29637716 e DENSITY 0.056142541 0.0892985 0.628706423 LANDAREA -1.744165638 2.234037353 -0.780723579 e df P-value (3 Lower 95% Upper 95% -6556.428293 7549.768385 -1221.7749 813.1298174 -5300.81818 8418.819692 -0.306492236 0.118530982 1.19691454 2.423120274 -0.128585481 0.240870562 -6.365624011 2.877292734 tttttttt R

Algebra & Trigonometry with Analytic Geometry
13th Edition
ISBN:9781133382119
Author:Swokowski
Publisher:Swokowski
Chapter2: Equations And Inequalities
Section2.1: Equations
Problem 75E

Related questions
Question
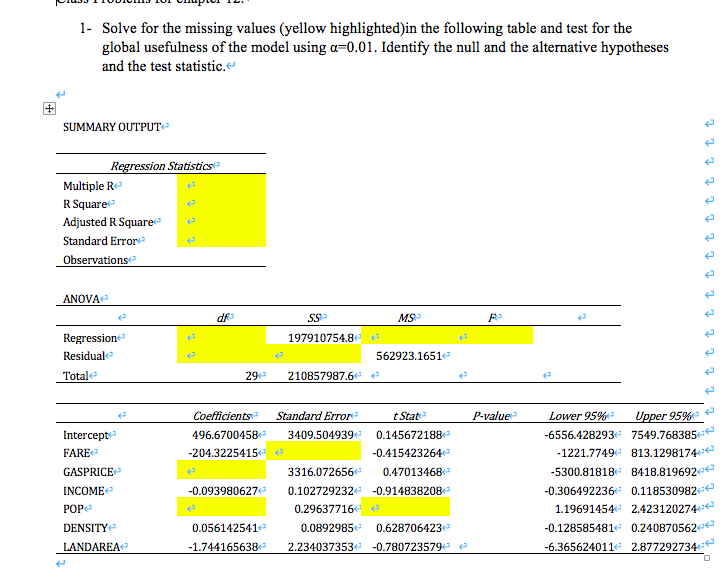
Transcribed Image Text:1- Solve for the missing values (yellow highlighted)in the following table and test for the
global usefulness of the model using a=0.01. Identify the null and the alternative hypotheses
and the test statistic.<
SUMMARY OUTPUT
Regression Statistics
Multiple Re
R Square
Adjusted R Square
e
Standard Errore
Observations
ANOVA
SS
MS
Regression
197910754.8
Residual
562923.1651
Total
29
210857987.6
Coefficients Standard Error
t State
0.145672188
Intercept
496.6700458
3409.504939
FARE
-204.3225415
-0.415423264
GASPRICE
3316.072656
0.47013468
INCOME
-0.093980627
0.102729232 -0.914838208
POPO
0.29637716 e
DENSITY
0.056142541
0.0892985 0.628706423
LANDAREA
-1.744165638
2.234037353
-0.780723579
df
P-value
(3
Lower 95%
-6556.428293
Upper 95%
7549.768385
-1221.7749 813.1298174
-5300.81818 8418.819692
-0.306492236 0.118530982
1.19691454 2.423120274
-0.128585481 0.240870562
-6.365624011 2.877292734
tttttttt
R
Expert Solution
This question has been solved!
Explore an expertly crafted, step-by-step solution for a thorough understanding of key concepts.

This is a popular solution!

Trending now
This is a popular solution!

Step by step
Solved in 3 steps with 3 images

Recommended textbooks for you
Algebra & Trigonometry with Analytic Geometry
Algebra
ISBN:
9781133382119
Author:
Swokowski
Publisher:
Cengage
Algebra & Trigonometry with Analytic Geometry
Algebra
ISBN:
9781133382119
Author:
Swokowski
Publisher:
Cengage