1) The owner of North Canadian River Cruises believes that the firm's ferry ridership is tied to the number of tourists visiting Oklahoma. The firm's data analyst has collected data over the past twelve years on the number of tourists visiting Oklahoma and the firm's ferry ridership (see the excel file "North Canadian River Cruises"). a) Construct a scatter plot for the sample data. Does there appear to be a positive or negative relationship between number of tourists and ferry ridership? b) Compute the correlation coefficient for the sample data. What is the direction of the relationship (positive, negative, or zero relationship) between the number of tourists and ferry ridership? What is the strength of the relationship between the number of tourists and ferry ridership? c) Develop a linear regression model and compute the regression equation based on the sample data. d) Using the regression equation obtained using the sample data, calculate the expected ferry ridership if 10,000 tourists visit Oklahoma in 2024. e) Based on the sample data, what percentage of the total variation in the dependent variable can be explained by the independent variable? f) Using the regression output, at the 0.05 level significance, evaluate the significance of the slope of the regression equation using a t-test. g) Using the regression output, at the 0.05 level significance, evaluate the significance of the slope of the regression equation using a p value approach.
1) The owner of North Canadian River Cruises believes that the firm's ferry ridership is tied to the number of tourists visiting Oklahoma. The firm's data analyst has collected data over the past twelve years on the number of tourists visiting Oklahoma and the firm's ferry ridership (see the excel file "North Canadian River Cruises"). a) Construct a scatter plot for the sample data. Does there appear to be a positive or negative relationship between number of tourists and ferry ridership? b) Compute the correlation coefficient for the sample data. What is the direction of the relationship (positive, negative, or zero relationship) between the number of tourists and ferry ridership? What is the strength of the relationship between the number of tourists and ferry ridership? c) Develop a linear regression model and compute the regression equation based on the sample data. d) Using the regression equation obtained using the sample data, calculate the expected ferry ridership if 10,000 tourists visit Oklahoma in 2024. e) Based on the sample data, what percentage of the total variation in the dependent variable can be explained by the independent variable? f) Using the regression output, at the 0.05 level significance, evaluate the significance of the slope of the regression equation using a t-test. g) Using the regression output, at the 0.05 level significance, evaluate the significance of the slope of the regression equation using a p value approach.

Glencoe Algebra 1, Student Edition, 9780079039897, 0079039898, 2018
18th Edition
ISBN:9780079039897
Author:Carter
Publisher:Carter
Chapter4: Equations Of Linear Functions
Section: Chapter Questions
Problem 8SGR

Related questions
Question
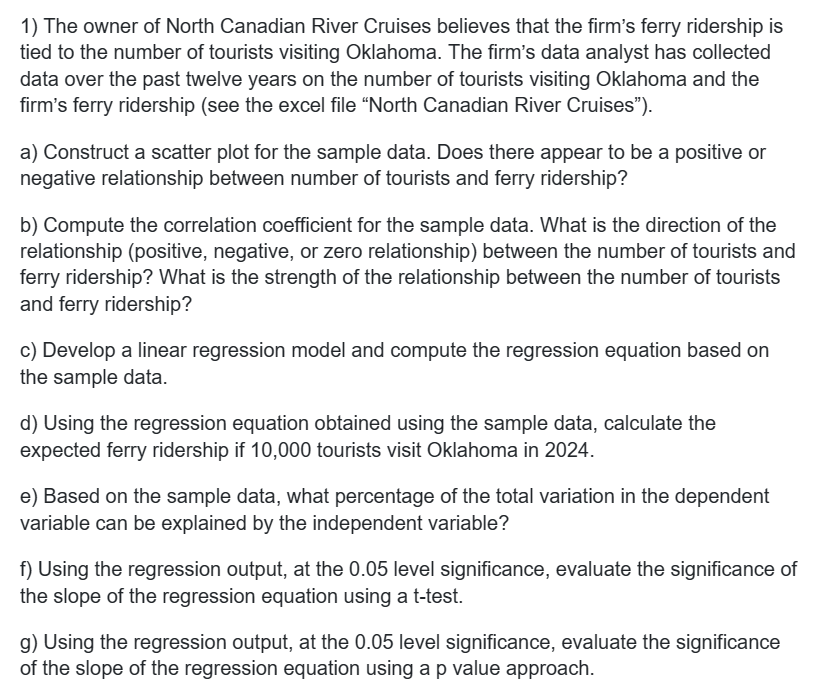
Transcribed Image Text:1) The owner of North Canadian River Cruises believes that the firm's ferry ridership is
tied to the number of tourists visiting Oklahoma. The firm's data analyst has collected
data over the past twelve years on the number of tourists visiting Oklahoma and the
firm's ferry ridership (see the excel file "North Canadian River Cruises").
a) Construct a scatter plot for the sample data. Does there appear to be a positive or
negative relationship between number of tourists and ferry ridership?
b) Compute the correlation coefficient for the sample data. What is the direction of the
relationship (positive, negative, or zero relationship) between the number of tourists and
ferry ridership? What is the strength of the relationship between the number of tourists
and ferry ridership?
c) Develop a linear regression model and compute the regression equation based on
the sample data.
d) Using the regression equation obtained using the sample data, calculate the
expected ferry ridership if 10,000 tourists visit Oklahoma in 2024.
e) Based on the sample data, what percentage of the total variation in the dependent
variable can be explained by the independent variable?
f) Using the regression output, at the 0.05 level significance, evaluate the significance of
the slope of the regression equation using a t-test.
g) Using the regression output, at the 0.05 level significance, evaluate the significance
of the slope of the regression equation using a p value approach.
Expert Solution
This question has been solved!
Explore an expertly crafted, step-by-step solution for a thorough understanding of key concepts.

This is a popular solution!

Trending now
This is a popular solution!

Step by step
Solved in 2 steps

Recommended textbooks for you
Glencoe Algebra 1, Student Edition, 9780079039897…
Algebra
ISBN:
9780079039897
Author:
Carter
Publisher:
McGraw Hill

Glencoe Algebra 1, Student Edition, 9780079039897…
Algebra
ISBN:
9780079039897
Author:
Carter
Publisher:
McGraw Hill