1) The Quality Manager at Soda Pop Inc. thinks that there is a relationship between the temperature of the product and the percent foam for a soda. Create a scatter diagram with the following data, from the last 20 days. Is the Quality Manager correct, is there a relationship between the variables? If so, how would you describe the relationship? Turn in your scatter diagram and a short answer to the questions above. Be sure to use good graphing techniques. Day 1 2 MAHASAGG8 3 4 5 6 7 9 10 11 12 13 14 15 16 17 18 19 20 Product Temperature in Degress Celsius 2.2222 3.3333 2.7778 6.6667 7.7778 3.8889 5.0000 8.3333 3.8889 4.4444 6.6667 5.5556 3.3333 5.0000 7.2222 9.4444 10.0000 8.8889 7.7778 5.0000 % Foam 15 19 21 30 36 20 25 36 22 23 32 33 20 27 35 38 40 42 40 30
1) The Quality Manager at Soda Pop Inc. thinks that there is a relationship between the temperature of the product and the percent foam for a soda. Create a scatter diagram with the following data, from the last 20 days. Is the Quality Manager correct, is there a relationship between the variables? If so, how would you describe the relationship? Turn in your scatter diagram and a short answer to the questions above. Be sure to use good graphing techniques. Day 1 2 MAHASAGG8 3 4 5 6 7 9 10 11 12 13 14 15 16 17 18 19 20 Product Temperature in Degress Celsius 2.2222 3.3333 2.7778 6.6667 7.7778 3.8889 5.0000 8.3333 3.8889 4.4444 6.6667 5.5556 3.3333 5.0000 7.2222 9.4444 10.0000 8.8889 7.7778 5.0000 % Foam 15 19 21 30 36 20 25 36 22 23 32 33 20 27 35 38 40 42 40 30

Glencoe Algebra 1, Student Edition, 9780079039897, 0079039898, 2018
18th Edition
ISBN:9780079039897
Author:Carter
Publisher:Carter
Chapter10: Statistics
Section10.6: Summarizing Categorical Data
Problem 23PPS

Related questions
Question
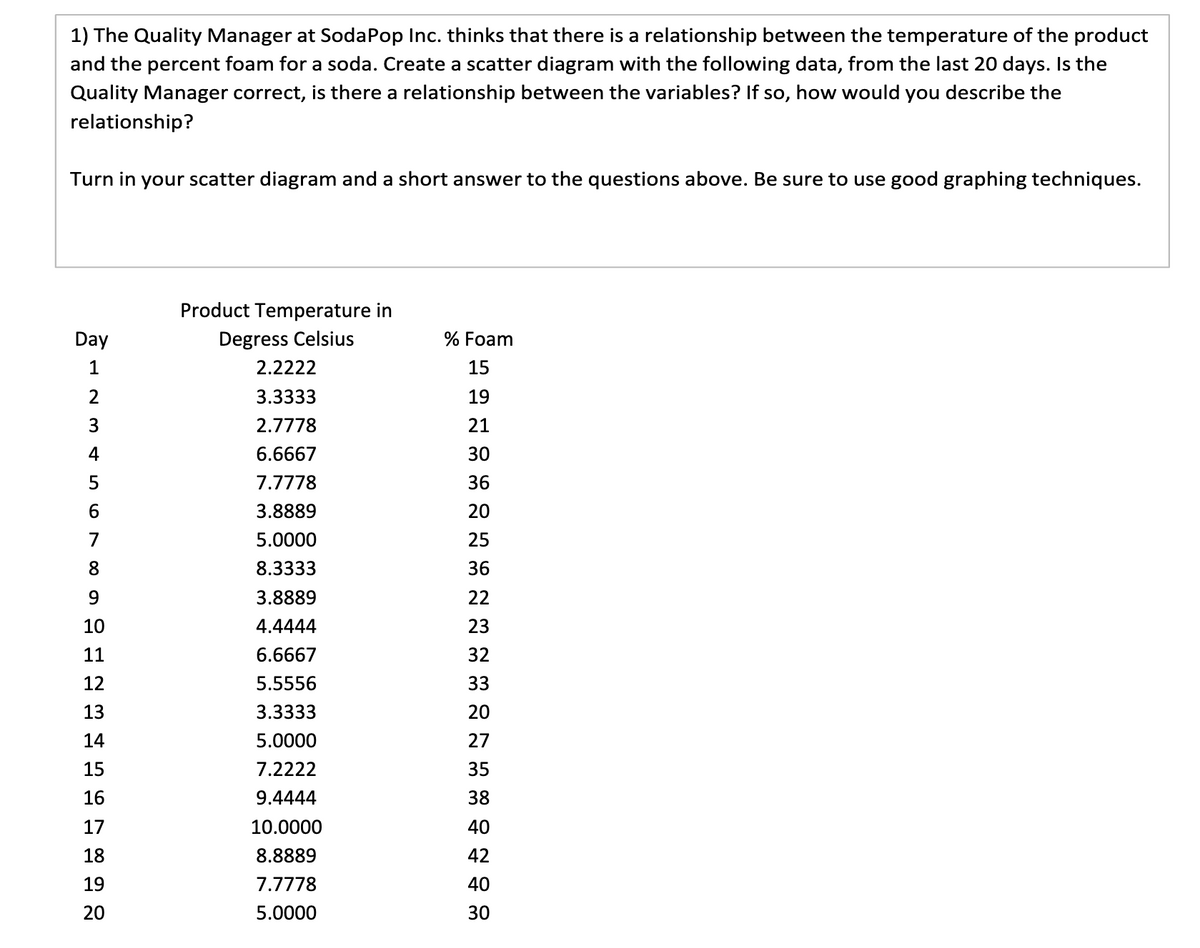
The Quality Manager at SodaPop Inc. thinks that there is a relationship between the temperature of the product
and the percent foam for a soda. Create ascatter diagram with the following data, from the last 20 days. Is the
Quality Manager correct, is there a relationship between the variables? If so, how would you describe the
relationship?
Turn in your scatter diagram and a short answer to the questions above. Be sure to use good graphing techniques.
and the percent foam for a soda. Create a
Quality Manager correct, is there a relationship between the variables? If so, how would you describe the
relationship?
Turn in your scatter diagram and a short answer to the questions above. Be sure to use good graphing techniques.
Day
Product Temperature in
Degress Celsius % Foam
1 2.2222 15
2 3.3333 19
3 2.7778 21
4 6.6667 30
5 7.7778 36
6 3.8889 20
7 5.0000 25
8 8.3333 36
9 3.8889 22
10 4.4444 23
11 6.6667 32
12 5.5556 33
13 3.3333 20
14 5.0000 27
15 7.2222 35
16 9.4444 38
17 10.0000 40
18 8.8889 42
19 7.7778 40
20 5.0000 30
Transcribed Image Text:1) The Quality Manager at Soda Pop Inc. thinks that there is a relationship between the temperature of the product
and the percent foam for a soda. Create a scatter diagram with the following data, from the last 20 days. Is the
Quality Manager correct, is there a relationship between the variables? If so, how would you describe the
relationship?
Turn in your scatter diagram and a short answer to the questions above. Be sure to use good graphing techniques.
Day
TEL 00
1
2
3
4
5
6
7
8
9
10
11
12
13
14
15
16
17
18
19
20
Product Temperature in
Degress Celsius
2.2222
3.3333
2.7778
6.6667
7.7778
3.8889
5.0000
8.3333
3.8889
4.4444
6.6667
5.5556
3.3333
5.0000
7.2222
9.4444
10.0000
8.8889
7.7778
5.0000
% Foam
15
19
21
30
36
20
25
36
22
23
32
33
20
27
35
38
40
42
40
30
Expert Solution
This question has been solved!
Explore an expertly crafted, step-by-step solution for a thorough understanding of key concepts.

This is a popular solution!

Trending now
This is a popular solution!

Step by step
Solved in 4 steps with 2 images

Recommended textbooks for you
Glencoe Algebra 1, Student Edition, 9780079039897…
Algebra
ISBN:
9780079039897
Author:
Carter
Publisher:
McGraw Hill

Big Ideas Math A Bridge To Success Algebra 1: Stu…
Algebra
ISBN:
9781680331141
Author:
HOUGHTON MIFFLIN HARCOURT
Publisher:
Houghton Mifflin Harcourt
Glencoe Algebra 1, Student Edition, 9780079039897…
Algebra
ISBN:
9780079039897
Author:
Carter
Publisher:
McGraw Hill
Big Ideas Math A Bridge To Success Algebra 1: Stu…
Algebra
ISBN:
9781680331141
Author:
HOUGHTON MIFFLIN HARCOURT
Publisher:
Houghton Mifflin Harcourt