1) Using the information from tables 1 and 2 below, calculate the cumulative percentage passing for both coarse and fine aggregates. Plot separate graphs for the coarse and fine aggregates (Cumulative Percentage Passing vs. Sieve Size) and the combined grades Source of Material: Guanapo Source of Material: Guanapo
1) Using the information from tables 1 and 2 below, calculate the cumulative percentage passing for both coarse and fine aggregates. Plot separate graphs for the coarse and fine aggregates (Cumulative Percentage Passing vs. Sieve Size) and the combined grades Source of Material: Guanapo Source of Material: Guanapo

Chapter2: Loads On Structures
Section: Chapter Questions
Problem 1P

Related questions

Question
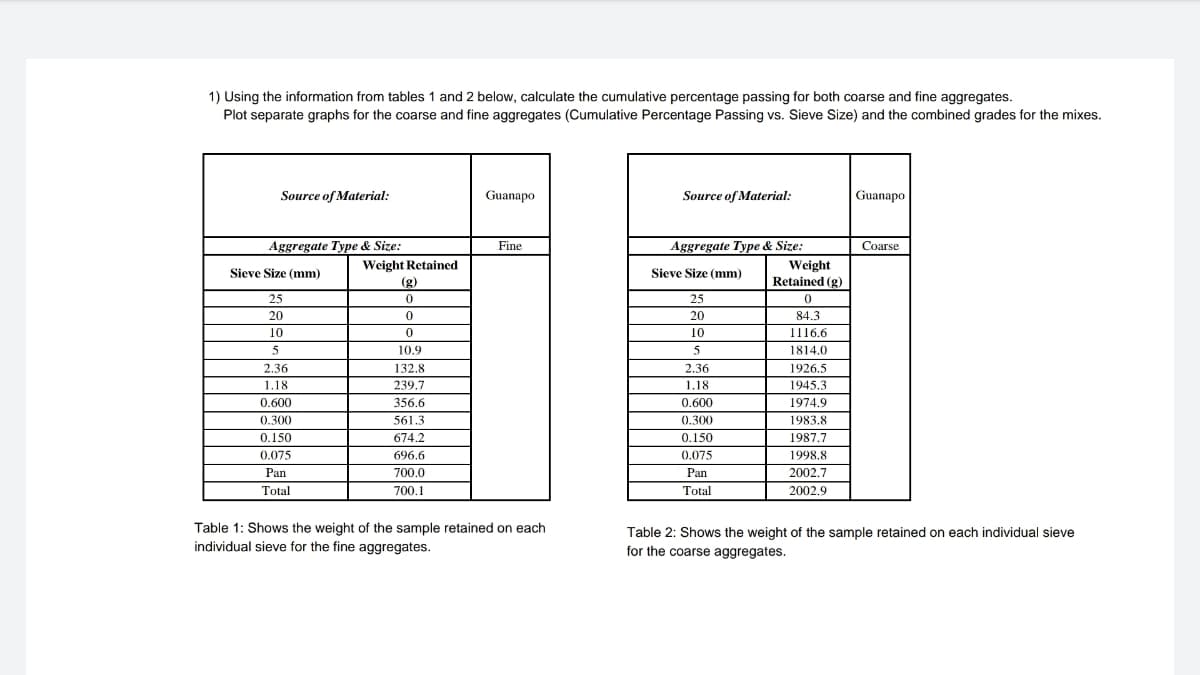
Transcribed Image Text:1) Using the information from tables 1 and 2 below, calculate the cumulative percentage passing for both coarse and fine aggregates.
Plot separate graphs for the coarse and fine aggregates (Cumulative Percentage Passing vs. Sieve Size) and the combined grades for the mixes.
Source of Material:
Guanapo
Source of Material:
Guanapo
Aggregate Type & Size:
Fine
Aggregate Type & Size:
Coarse
Weight Retained
(g)
Weight
Sieve Size (mm)
Sieve Size (mm)
Retained (g)
25
25
20
20
84.3
10
10
1116.6
5
10.9
5
1814.0
2.36
132.8
2.36
1926.5
1.18
239.7
1.18
1945.3
0.600
356.6
0.600
1974.9
0.300
561.3
0.300
1983.8
0.150
674.2
0.150
1987.7
0.075
696.6
0.075
1998.8
Pan
700.0
Pan
2002.7
Total
700.1
Total
2002.9
Table 1: Shows the weight of the sample retained on each
individual sieve for the fine aggregates.
Table 2: Shows the weight of the sample retained on each individual sieve
for the coarse aggregates.
Expert Solution
This question has been solved!
Explore an expertly crafted, step-by-step solution for a thorough understanding of key concepts.

Step by step
Solved in 4 steps with 3 images

Knowledge Booster


Learn more about
Need a deep-dive on the concept behind this application? Look no further. Learn more about this topic, civil-engineering and related others by exploring similar questions and additional content below.Recommended textbooks for you

Structural Analysis (10th Edition)
Civil Engineering
ISBN:
9780134610672
Author:
Russell C. Hibbeler
Publisher:
PEARSON

Principles of Foundation Engineering (MindTap Cou…
Civil Engineering
ISBN:
9781337705028
Author:
Braja M. Das, Nagaratnam Sivakugan
Publisher:
Cengage Learning
Structural Analysis (10th Edition)
Civil Engineering
ISBN:
9780134610672
Author:
Russell C. Hibbeler
Publisher:
PEARSON
Principles of Foundation Engineering (MindTap Cou…
Civil Engineering
ISBN:
9781337705028
Author:
Braja M. Das, Nagaratnam Sivakugan
Publisher:
Cengage Learning

Fundamentals of Structural Analysis
Civil Engineering
ISBN:
9780073398006
Author:
Kenneth M. Leet Emeritus, Chia-Ming Uang, Joel Lanning
Publisher:
McGraw-Hill Education


Traffic and Highway Engineering
Civil Engineering
ISBN:
9781305156241
Author:
Garber, Nicholas J.
Publisher:
Cengage Learning