1) Which of the following statements is/are true? 1. The relative frequency is equal to the percentage frequency. II. A Histogram displays comparisons between categories while the bar graph presents frequencies in a data set. a. I only b. Il only c. both are true
1) Which of the following statements is/are true? 1. The relative frequency is equal to the percentage frequency. II. A Histogram displays comparisons between categories while the bar graph presents frequencies in a data set. a. I only b. Il only c. both are true

Glencoe Algebra 1, Student Edition, 9780079039897, 0079039898, 2018
18th Edition
ISBN:9780079039897
Author:Carter
Publisher:Carter
Chapter10: Statistics
Section10.6: Summarizing Categorical Data
Problem 4CGP

Related questions
Question
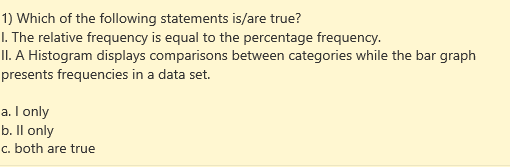
Transcribed Image Text:1) Which of the following statements is/are true?
I. The relative frequency is equal to the percentage frequency.
II. A Histogram displays comparisons between categories while the bar graph
presents frequencies in a data set.
a. I only
b. Il only
c. both are true
Expert Solution
This question has been solved!
Explore an expertly crafted, step-by-step solution for a thorough understanding of key concepts.

Step by step
Solved in 2 steps

Recommended textbooks for you
Glencoe Algebra 1, Student Edition, 9780079039897…
Algebra
ISBN:
9780079039897
Author:
Carter
Publisher:
McGraw Hill
Glencoe Algebra 1, Student Edition, 9780079039897…
Algebra
ISBN:
9780079039897
Author:
Carter
Publisher:
McGraw Hill