(1) Write out the regression equation (2) What is the sample size used in this investigation? (3) Determine the values of *, ** and ***, ****
(1) Write out the regression equation (2) What is the sample size used in this investigation? (3) Determine the values of *, ** and ***, ****

Glencoe Algebra 1, Student Edition, 9780079039897, 0079039898, 2018
18th Edition
ISBN:9780079039897
Author:Carter
Publisher:Carter
Chapter4: Equations Of Linear Functions
Section: Chapter Questions
Problem 4SGR

Related questions
Question
(1) Write out the regression equation
(2) What is the sample size used in this investigation?
(3) Determine the values of *, ** and ***, ****
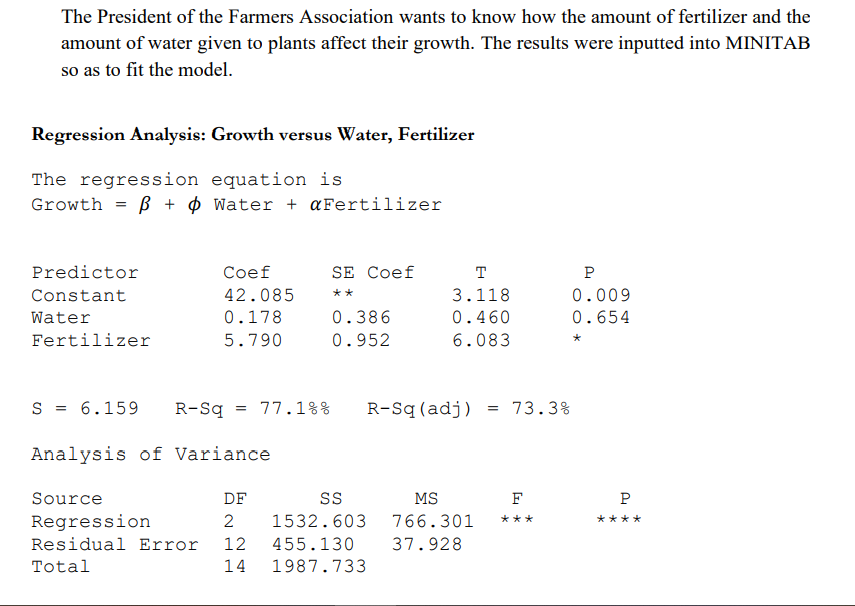
Transcribed Image Text:The President of the Farmers Association wants to know how the amount of fertilizer and the
amount of water given to plants affect their growth. The results were inputted into MINITAB
so as to fit the model.
Regression Analysis: Growth versus Water, Fertilizer
The regression equation is
Growth = ß + $ Water + aFertilizer
Predictor
Сoef
SE Coef
T
P
Constant
42.085
3.118
0.009
**
Water
0.178
0.386
0.460
0.654
Fertilizer
5.790
0.952
6.083
6.159
R-Sq
77.1%%
R-Sq (adj)
= 73.3%
Analysis of Variance
Source
DF
MS
F
P
Regression
Residual Error
2
1532.603
766.301
***
****
12
455.130
37.928
Total
14
1987.733
Expert Solution
This question has been solved!
Explore an expertly crafted, step-by-step solution for a thorough understanding of key concepts.

This is a popular solution!

Trending now
This is a popular solution!

Step by step
Solved in 4 steps with 3 images

Recommended textbooks for you
Glencoe Algebra 1, Student Edition, 9780079039897…
Algebra
ISBN:
9780079039897
Author:
Carter
Publisher:
McGraw Hill

Trigonometry (MindTap Course List)
Trigonometry
ISBN:
9781305652224
Author:
Charles P. McKeague, Mark D. Turner
Publisher:
Cengage Learning

Algebra & Trigonometry with Analytic Geometry
Algebra
ISBN:
9781133382119
Author:
Swokowski
Publisher:
Cengage
Glencoe Algebra 1, Student Edition, 9780079039897…
Algebra
ISBN:
9780079039897
Author:
Carter
Publisher:
McGraw Hill
Trigonometry (MindTap Course List)
Trigonometry
ISBN:
9781305652224
Author:
Charles P. McKeague, Mark D. Turner
Publisher:
Cengage Learning
Algebra & Trigonometry with Analytic Geometry
Algebra
ISBN:
9781133382119
Author:
Swokowski
Publisher:
Cengage


Algebra and Trigonometry (MindTap Course List)
Algebra
ISBN:
9781305071742
Author:
James Stewart, Lothar Redlin, Saleem Watson
Publisher:
Cengage Learning

Big Ideas Math A Bridge To Success Algebra 1: Stu…
Algebra
ISBN:
9781680331141
Author:
HOUGHTON MIFFLIN HARCOURT
Publisher:
Houghton Mifflin Harcourt