1) Write the interpretation of the following regression results, including intercept and coefficient estimates, given that estimations are through a representative sample of a population. Testscore, = 0.5 +0.89sleep hours; 2) Rewrite the regression results with residual terms, and give examples of 2 other variables that are not part of the equation but should be added to reduce "selection bias" |
1) Write the interpretation of the following regression results, including intercept and coefficient estimates, given that estimations are through a representative sample of a population. Testscore, = 0.5 +0.89sleep hours; 2) Rewrite the regression results with residual terms, and give examples of 2 other variables that are not part of the equation but should be added to reduce "selection bias" |

Glencoe Algebra 1, Student Edition, 9780079039897, 0079039898, 2018
18th Edition
ISBN:9780079039897
Author:Carter
Publisher:Carter
Chapter4: Equations Of Linear Functions
Section4.6: Regression And Median-fit Lines
Problem 4GP

Related questions
Question
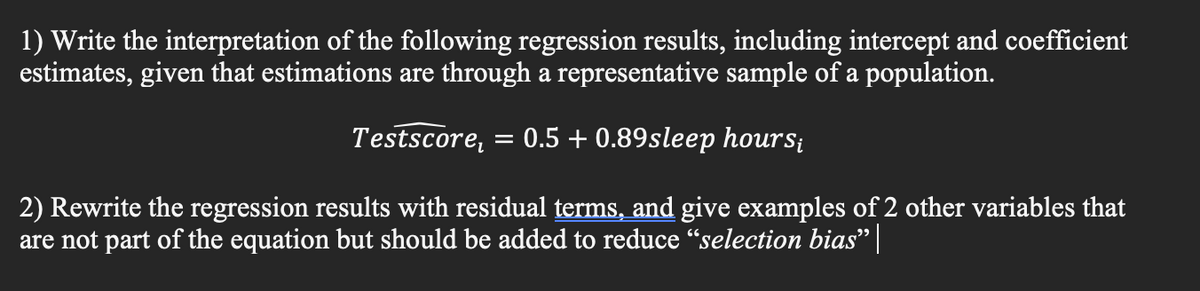
Transcribed Image Text:1) Write the interpretation of the following regression results, including intercept and coefficient
estimates, given that estimations are through a representative sample of a population.
Testscore, = 0.5 +0.89sleep hours;
2) Rewrite the regression results with residual terms, and give examples of 2 other variables that
are not part of the equation but should be added to reduce "selection bias" |
Expert Solution
This question has been solved!
Explore an expertly crafted, step-by-step solution for a thorough understanding of key concepts.

This is a popular solution!

Trending now
This is a popular solution!

Step by step
Solved in 3 steps

Recommended textbooks for you
Glencoe Algebra 1, Student Edition, 9780079039897…
Algebra
ISBN:
9780079039897
Author:
Carter
Publisher:
McGraw Hill

Functions and Change: A Modeling Approach to Coll…
Algebra
ISBN:
9781337111348
Author:
Bruce Crauder, Benny Evans, Alan Noell
Publisher:
Cengage Learning
Glencoe Algebra 1, Student Edition, 9780079039897…
Algebra
ISBN:
9780079039897
Author:
Carter
Publisher:
McGraw Hill
Functions and Change: A Modeling Approach to Coll…
Algebra
ISBN:
9781337111348
Author:
Bruce Crauder, Benny Evans, Alan Noell
Publisher:
Cengage Learning