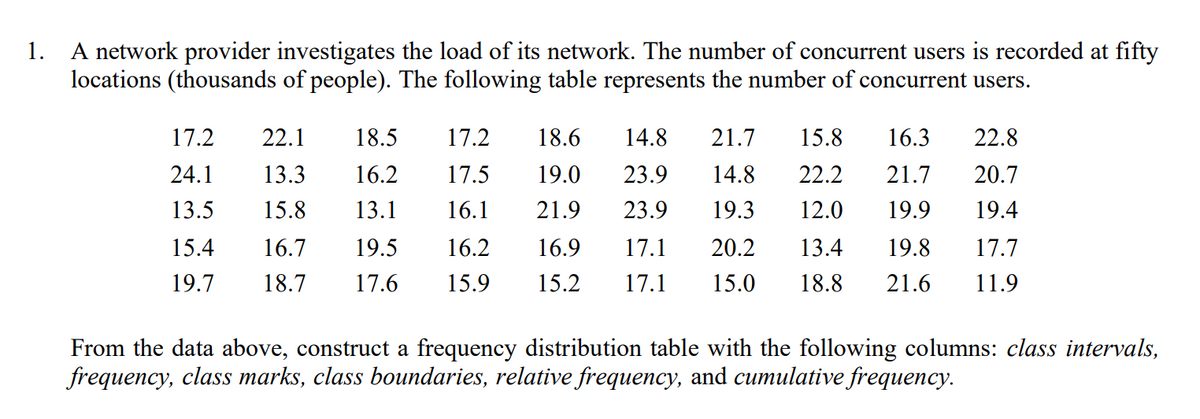
1. A network provider investigates the load of its network. The number of concurrent users is recorded at fifty locations (thousands of people). The following table represents the number of concurrent users. 17.2 22.1 18.5 17.2 18.6 14.8 21.7 15.8 16.3 22.8 24.1 13.3 16.2 17.5 19.0 23.9 14.8 22.2 21.7 20.7 13.5 15.8 13.1 16.1 21.9 23.9 19.3 12.0 19.9 19.4 15.4 16.7 19.5 16.2 16.9 17.1 20.2 13.4 19.8 17.7 19.7 18.7 17.6 15.9 15.2 17.1 15.0 18.8 21.6 11.9 From the data above, construct a frequency distribution table with the following columns: class intervals, frequency, class marks, class boundaries, relative frequency, and cumulative frequency.
1. A network provider investigates the load of its network. The number of concurrent users is recorded at fifty locations (thousands of people). The following table represents the number of concurrent users. 17.2 22.1 18.5 17.2 18.6 14.8 21.7 15.8 16.3 22.8 24.1 13.3 16.2 17.5 19.0 23.9 14.8 22.2 21.7 20.7 13.5 15.8 13.1 16.1 21.9 23.9 19.3 12.0 19.9 19.4 15.4 16.7 19.5 16.2 16.9 17.1 20.2 13.4 19.8 17.7 19.7 18.7 17.6 15.9 15.2 17.1 15.0 18.8 21.6 11.9 From the data above, construct a frequency distribution table with the following columns: class intervals, frequency, class marks, class boundaries, relative frequency, and cumulative frequency.

Linear Algebra: A Modern Introduction
4th Edition
ISBN:9781285463247
Author:David Poole
Publisher:David Poole
Chapter2: Systems Of Linear Equations
Section2.4: Applications
Problem 1EQ: 1. Suppose that, in Example 2.27, 400 units of food A, 600 units of B, and 600 units of C are placed...

Related questions
Question
Transcribed Image Text:1. A network provider investigates the load of its network. The number of concurrent users is recorded at fifty
locations (thousands of people). The following table represents the number of concurrent users.
17.2
22.1
18.5
17.2
18.6
14.8
21.7
15.8
16.3
22.8
24.1
13.3
16.2
17.5
19.0
23.9
14.8
22.2
21.7
20.7
13.5
15.8
13.1
16.1
21.9
23.9
19.3
12.0
19.9
19.4
15.4
16.7
19.5
16.2
16.9
17.1
20.2
13.4
19.8
17.7
19.7
18.7
17.6
15.9
15.2
17.1
15.0
18.8
21.6
11.9
From the data above, construct a frequency distribution table with the following columns: class intervals,
frequency, class marks, class boundaries, relative frequency, and cumulative frequency.
Expert Solution
This question has been solved!
Explore an expertly crafted, step-by-step solution for a thorough understanding of key concepts.

This is a popular solution!

Trending now
This is a popular solution!

Step by step
Solved in 2 steps

Recommended textbooks for you
Linear Algebra: A Modern Introduction
Algebra
ISBN:
9781285463247
Author:
David Poole
Publisher:
Cengage Learning

Glencoe Algebra 1, Student Edition, 9780079039897…
Algebra
ISBN:
9780079039897
Author:
Carter
Publisher:
McGraw Hill
Linear Algebra: A Modern Introduction
Algebra
ISBN:
9781285463247
Author:
David Poole
Publisher:
Cengage Learning
Glencoe Algebra 1, Student Edition, 9780079039897…
Algebra
ISBN:
9780079039897
Author:
Carter
Publisher:
McGraw Hill